Armenian vs Immigrants from Dominican Republic Currently Married
COMPARE
Armenian
Immigrants from Dominican Republic
Currently Married
Currently Married Comparison
Armenians
Immigrants from Dominican Republic
46.8%
CURRENTLY MARRIED
58.2/ 100
METRIC RATING
169th/ 347
METRIC RANK
38.9%
CURRENTLY MARRIED
0.0/ 100
METRIC RATING
342nd/ 347
METRIC RANK
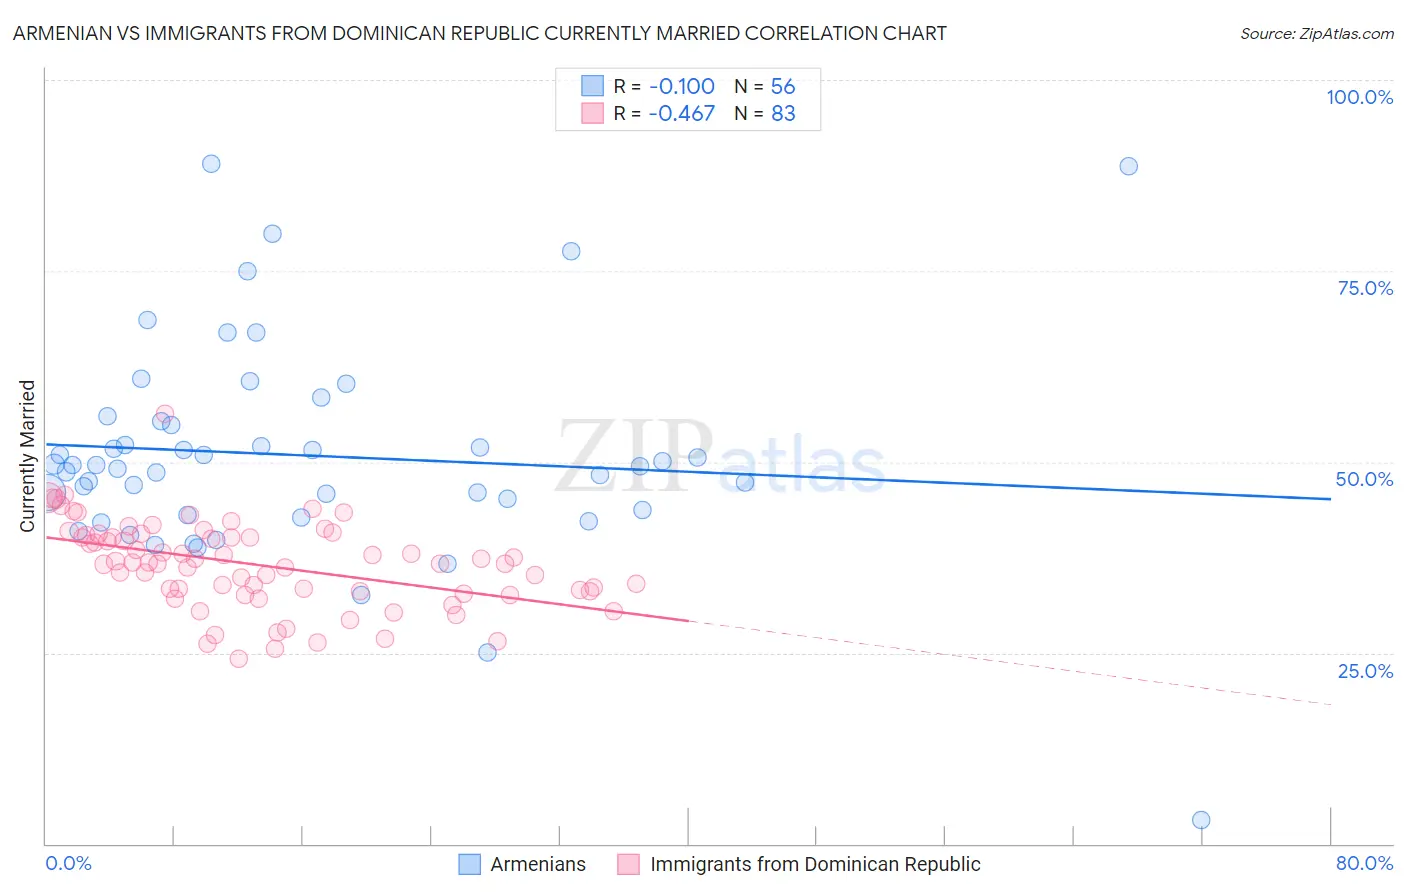
Armenian vs Immigrants from Dominican Republic Currently Married Correlation Chart
The statistical analysis conducted on geographies consisting of 310,938,926 people shows a poor negative correlation between the proportion of Armenians and percentage of population currently married in the United States with a correlation coefficient (R) of -0.100 and weighted average of 46.8%. Similarly, the statistical analysis conducted on geographies consisting of 275,115,550 people shows a moderate negative correlation between the proportion of Immigrants from Dominican Republic and percentage of population currently married in the United States with a correlation coefficient (R) of -0.467 and weighted average of 38.9%, a difference of 20.1%.
Currently Married Correlation Summary
| Measurement | Armenian | Immigrants from Dominican Republic |
| Minimum | 3.1% | 24.2% |
| Maximum | 89.1% | 56.2% |
| Range | 86.0% | 32.0% |
| Mean | 50.8% | 36.5% |
| Median | 49.5% | 36.8% |
| Interquartile 25% (IQ1) | 43.4% | 33.0% |
| Interquartile 75% (IQ3) | 55.1% | 40.5% |
| Interquartile Range (IQR) | 11.7% | 7.4% |
| Standard Deviation (Sample) | 14.2% | 5.7% |
| Standard Deviation (Population) | 14.0% | 5.7% |
Similar Demographics by Currently Married
Demographics Similar to Armenians by Currently Married
In terms of currently married, the demographic groups most similar to Armenians are Immigrants from Afghanistan (46.8%, a difference of 0.0%), Spaniard (46.8%, a difference of 0.020%), Immigrants from Syria (46.8%, a difference of 0.040%), Immigrants from Latvia (46.7%, a difference of 0.050%), and Samoan (46.8%, a difference of 0.060%).
| Demographics | Rating | Rank | Currently Married |
| Immigrants | Nonimmigrants | 65.4 /100 | #162 | Good 46.9% |
| Delaware | 64.7 /100 | #163 | Good 46.9% |
| Immigrants | Western Asia | 64.2 /100 | #164 | Good 46.9% |
| Samoans | 59.8 /100 | #165 | Average 46.8% |
| Immigrants | Syria | 59.3 /100 | #166 | Average 46.8% |
| Spaniards | 58.8 /100 | #167 | Average 46.8% |
| Immigrants | Afghanistan | 58.2 /100 | #168 | Average 46.8% |
| Armenians | 58.2 /100 | #169 | Average 46.8% |
| Immigrants | Latvia | 56.7 /100 | #170 | Average 46.7% |
| Immigrants | Zimbabwe | 52.4 /100 | #171 | Average 46.7% |
| Aleuts | 52.0 /100 | #172 | Average 46.7% |
| Tlingit-Haida | 51.2 /100 | #173 | Average 46.7% |
| Peruvians | 50.0 /100 | #174 | Average 46.6% |
| Immigrants | Brazil | 49.9 /100 | #175 | Average 46.6% |
| Hawaiians | 48.6 /100 | #176 | Average 46.6% |
Demographics Similar to Immigrants from Dominican Republic by Currently Married
In terms of currently married, the demographic groups most similar to Immigrants from Dominican Republic are Navajo (39.0%, a difference of 0.17%), Immigrants from Grenada (39.1%, a difference of 0.52%), Dominican (39.5%, a difference of 1.5%), Cape Verdean (39.6%, a difference of 1.6%), and Black/African American (39.6%, a difference of 1.7%).
| Demographics | Rating | Rank | Currently Married |
| Yup'ik | 0.0 /100 | #333 | Tragic 39.9% |
| Puerto Ricans | 0.0 /100 | #334 | Tragic 39.9% |
| Lumbee | 0.0 /100 | #335 | Tragic 39.8% |
| British West Indians | 0.0 /100 | #336 | Tragic 39.8% |
| Blacks/African Americans | 0.0 /100 | #337 | Tragic 39.6% |
| Cape Verdeans | 0.0 /100 | #338 | Tragic 39.6% |
| Dominicans | 0.0 /100 | #339 | Tragic 39.5% |
| Immigrants | Grenada | 0.0 /100 | #340 | Tragic 39.1% |
| Navajo | 0.0 /100 | #341 | Tragic 39.0% |
| Immigrants | Dominican Republic | 0.0 /100 | #342 | Tragic 38.9% |
| Pueblo | 0.0 /100 | #343 | Tragic 38.2% |
| Immigrants | Cabo Verde | 0.0 /100 | #344 | Tragic 37.8% |
| Tohono O'odham | 0.0 /100 | #345 | Tragic 36.8% |
| Hopi | 0.0 /100 | #346 | Tragic 36.5% |
| Pima | 0.0 /100 | #347 | Tragic 35.9% |