Immigrants from Korea vs Immigrants from India Currently Married
COMPARE
Immigrants from Korea
Immigrants from India
Currently Married
Currently Married Comparison
Immigrants from Korea
Immigrants from India
49.0%
CURRENTLY MARRIED
99.6/ 100
METRIC RATING
26th/ 347
METRIC RANK
51.8%
CURRENTLY MARRIED
100.0/ 100
METRIC RATING
1st/ 347
METRIC RANK
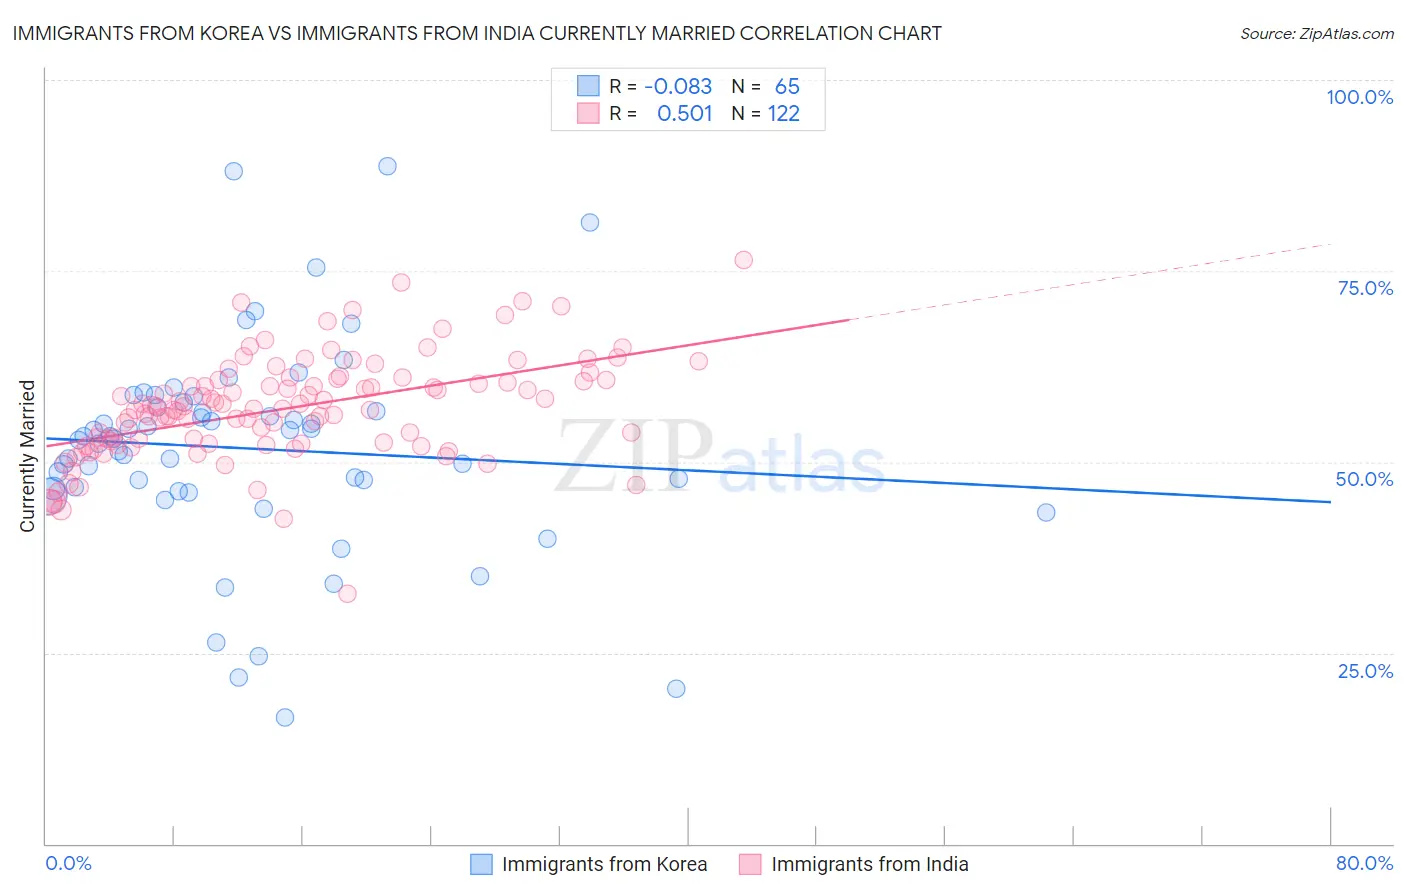
Immigrants from Korea vs Immigrants from India Currently Married Correlation Chart
The statistical analysis conducted on geographies consisting of 416,263,579 people shows a slight negative correlation between the proportion of Immigrants from Korea and percentage of population currently married in the United States with a correlation coefficient (R) of -0.083 and weighted average of 49.0%. Similarly, the statistical analysis conducted on geographies consisting of 434,052,762 people shows a substantial positive correlation between the proportion of Immigrants from India and percentage of population currently married in the United States with a correlation coefficient (R) of 0.501 and weighted average of 51.8%, a difference of 5.7%.
Currently Married Correlation Summary
| Measurement | Immigrants from Korea | Immigrants from India |
| Minimum | 16.6% | 32.7% |
| Maximum | 88.7% | 76.4% |
| Range | 72.1% | 43.7% |
| Mean | 51.8% | 57.0% |
| Median | 53.0% | 56.9% |
| Interquartile 25% (IQ1) | 46.4% | 52.4% |
| Interquartile 75% (IQ3) | 57.5% | 60.7% |
| Interquartile Range (IQR) | 11.1% | 8.3% |
| Standard Deviation (Sample) | 13.7% | 6.8% |
| Standard Deviation (Population) | 13.6% | 6.8% |
Similar Demographics by Currently Married
Demographics Similar to Immigrants from Korea by Currently Married
In terms of currently married, the demographic groups most similar to Immigrants from Korea are Maltese (49.0%, a difference of 0.050%), Lithuanian (49.0%, a difference of 0.060%), Burmese (48.9%, a difference of 0.070%), Welsh (48.9%, a difference of 0.11%), and Croatian (48.9%, a difference of 0.15%).
| Demographics | Rating | Rank | Currently Married |
| Europeans | 99.8 /100 | #19 | Exceptional 49.3% |
| Luxembourgers | 99.8 /100 | #20 | Exceptional 49.3% |
| Scottish | 99.8 /100 | #21 | Exceptional 49.2% |
| Bulgarians | 99.7 /100 | #22 | Exceptional 49.1% |
| Immigrants | Pakistan | 99.7 /100 | #23 | Exceptional 49.1% |
| Lithuanians | 99.6 /100 | #24 | Exceptional 49.0% |
| Maltese | 99.6 /100 | #25 | Exceptional 49.0% |
| Immigrants | Korea | 99.6 /100 | #26 | Exceptional 49.0% |
| Burmese | 99.6 /100 | #27 | Exceptional 48.9% |
| Welsh | 99.5 /100 | #28 | Exceptional 48.9% |
| Croatians | 99.5 /100 | #29 | Exceptional 48.9% |
| Eastern Europeans | 99.5 /100 | #30 | Exceptional 48.9% |
| Poles | 99.5 /100 | #31 | Exceptional 48.9% |
| Immigrants | Hong Kong | 99.5 /100 | #32 | Exceptional 48.9% |
| Irish | 99.5 /100 | #33 | Exceptional 48.9% |
Demographics Similar to Immigrants from India by Currently Married
In terms of currently married, the demographic groups most similar to Immigrants from India are Thai (50.9%, a difference of 1.8%), Assyrian/Chaldean/Syriac (50.8%, a difference of 1.9%), Immigrants from Taiwan (50.7%, a difference of 2.0%), Danish (50.5%, a difference of 2.6%), and Norwegian (50.2%, a difference of 3.1%).
| Demographics | Rating | Rank | Currently Married |
| Immigrants | India | 100.0 /100 | #1 | Exceptional 51.8% |
| Thais | 100.0 /100 | #2 | Exceptional 50.9% |
| Assyrians/Chaldeans/Syriacs | 100.0 /100 | #3 | Exceptional 50.8% |
| Immigrants | Taiwan | 100.0 /100 | #4 | Exceptional 50.7% |
| Danes | 100.0 /100 | #5 | Exceptional 50.5% |
| Norwegians | 100.0 /100 | #6 | Exceptional 50.2% |
| Immigrants | South Central Asia | 100.0 /100 | #7 | Exceptional 50.0% |
| Swedes | 100.0 /100 | #8 | Exceptional 50.0% |
| Czechs | 99.9 /100 | #9 | Exceptional 49.9% |
| Filipinos | 99.9 /100 | #10 | Exceptional 49.7% |
| English | 99.9 /100 | #11 | Exceptional 49.7% |
| Swiss | 99.9 /100 | #12 | Exceptional 49.7% |
| Dutch | 99.9 /100 | #13 | Exceptional 49.6% |
| Germans | 99.9 /100 | #14 | Exceptional 49.6% |
| Pennsylvania Germans | 99.9 /100 | #15 | Exceptional 49.6% |