Armenian vs Immigrants from India In Labor Force | Age 16-19
COMPARE
Armenian
Immigrants from India
In Labor Force | Age 16-19
In Labor Force | Age 16-19 Comparison
Armenians
Immigrants from India
32.9%
IN LABOR FORCE | AGE 16-19
0.0/ 100
METRIC RATING
299th/ 347
METRIC RANK
35.0%
IN LABOR FORCE | AGE 16-19
3.5/ 100
METRIC RATING
237th/ 347
METRIC RANK
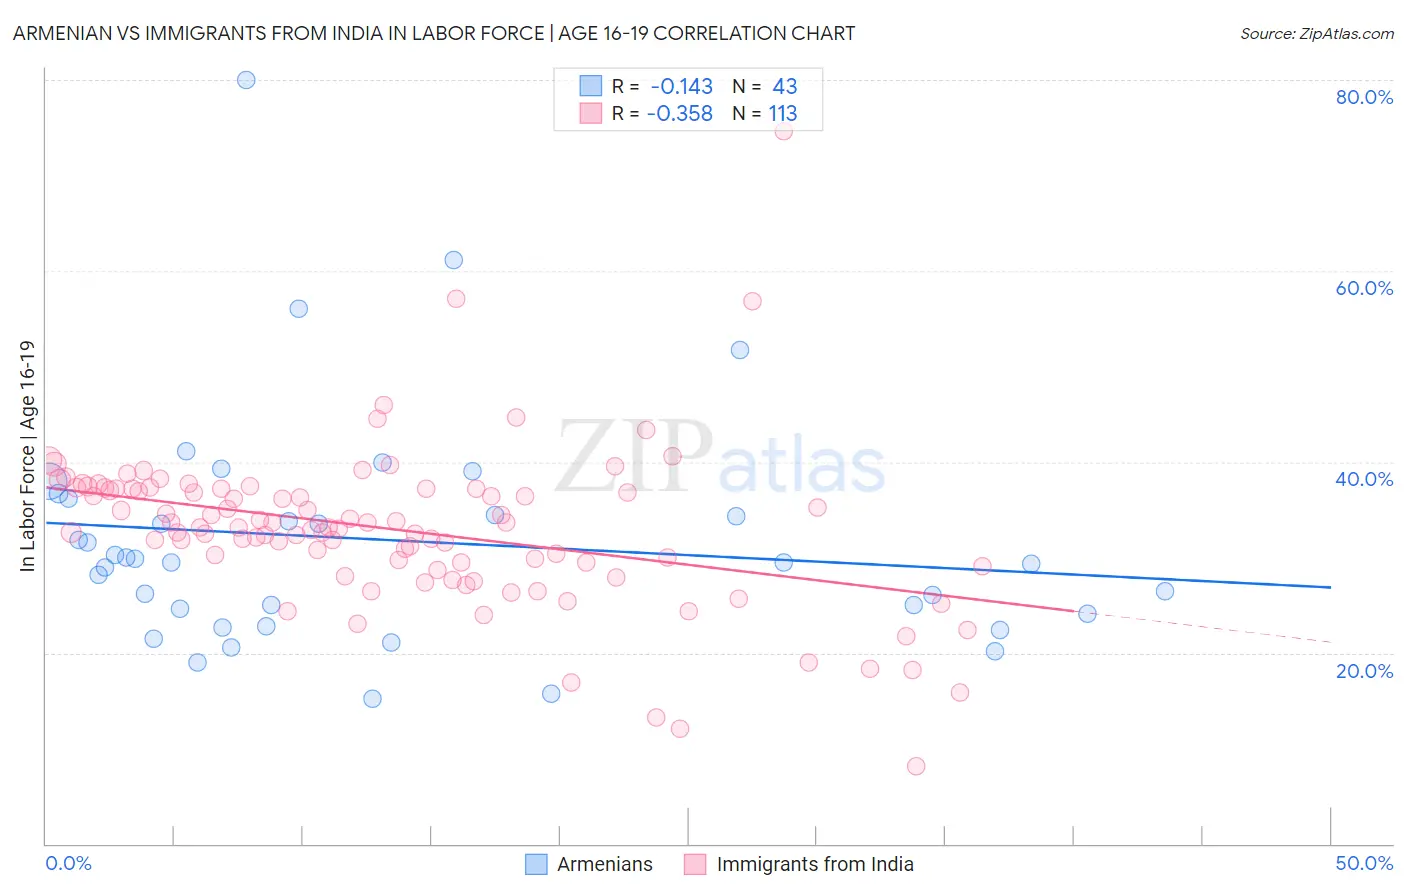
Armenian vs Immigrants from India In Labor Force | Age 16-19 Correlation Chart
The statistical analysis conducted on geographies consisting of 310,493,407 people shows a poor negative correlation between the proportion of Armenians and labor force participation rate among population between the ages 16 and 19 in the United States with a correlation coefficient (R) of -0.143 and weighted average of 32.9%. Similarly, the statistical analysis conducted on geographies consisting of 433,366,164 people shows a mild negative correlation between the proportion of Immigrants from India and labor force participation rate among population between the ages 16 and 19 in the United States with a correlation coefficient (R) of -0.358 and weighted average of 35.0%, a difference of 6.4%.
In Labor Force | Age 16-19 Correlation Summary
| Measurement | Armenian | Immigrants from India |
| Minimum | 15.3% | 8.1% |
| Maximum | 80.0% | 74.6% |
| Range | 64.7% | 66.5% |
| Mean | 31.8% | 32.9% |
| Median | 29.5% | 33.1% |
| Interquartile 25% (IQ1) | 24.1% | 29.2% |
| Interquartile 75% (IQ3) | 36.2% | 37.2% |
| Interquartile Range (IQR) | 12.1% | 8.0% |
| Standard Deviation (Sample) | 12.3% | 8.5% |
| Standard Deviation (Population) | 12.1% | 8.5% |
Similar Demographics by In Labor Force | Age 16-19
Demographics Similar to Armenians by In Labor Force | Age 16-19
In terms of in labor force | age 16-19, the demographic groups most similar to Armenians are Immigrants from Argentina (32.9%, a difference of 0.15%), Iranian (33.0%, a difference of 0.24%), Okinawan (32.8%, a difference of 0.39%), Belizean (32.8%, a difference of 0.53%), and Immigrants from Haiti (33.2%, a difference of 0.75%).
| Demographics | Rating | Rank | In Labor Force | Age 16-19 |
| Haitians | 0.1 /100 | #292 | Tragic 33.4% |
| Immigrants | South America | 0.1 /100 | #293 | Tragic 33.3% |
| Argentineans | 0.1 /100 | #294 | Tragic 33.3% |
| Yup'ik | 0.1 /100 | #295 | Tragic 33.3% |
| Jamaicans | 0.1 /100 | #296 | Tragic 33.2% |
| Immigrants | Haiti | 0.1 /100 | #297 | Tragic 33.2% |
| Iranians | 0.0 /100 | #298 | Tragic 33.0% |
| Armenians | 0.0 /100 | #299 | Tragic 32.9% |
| Immigrants | Argentina | 0.0 /100 | #300 | Tragic 32.9% |
| Okinawans | 0.0 /100 | #301 | Tragic 32.8% |
| Belizeans | 0.0 /100 | #302 | Tragic 32.8% |
| Immigrants | Dominica | 0.0 /100 | #303 | Tragic 32.5% |
| Israelis | 0.0 /100 | #304 | Tragic 32.4% |
| Nicaraguans | 0.0 /100 | #305 | Tragic 32.4% |
| Spanish American Indians | 0.0 /100 | #306 | Tragic 32.4% |
Demographics Similar to Immigrants from India by In Labor Force | Age 16-19
In terms of in labor force | age 16-19, the demographic groups most similar to Immigrants from India are Immigrants from Australia (35.1%, a difference of 0.030%), Immigrants from Vietnam (35.0%, a difference of 0.050%), Inupiat (35.0%, a difference of 0.14%), Immigrants from Philippines (35.1%, a difference of 0.17%), and Immigrants from Central America (35.0%, a difference of 0.23%).
| Demographics | Rating | Rank | In Labor Force | Age 16-19 |
| Immigrants | Honduras | 4.9 /100 | #230 | Tragic 35.2% |
| Immigrants | Syria | 4.5 /100 | #231 | Tragic 35.2% |
| Immigrants | Kazakhstan | 4.5 /100 | #232 | Tragic 35.2% |
| Immigrants | France | 4.3 /100 | #233 | Tragic 35.1% |
| Immigrants | Mexico | 4.2 /100 | #234 | Tragic 35.1% |
| Immigrants | Philippines | 4.0 /100 | #235 | Tragic 35.1% |
| Immigrants | Australia | 3.6 /100 | #236 | Tragic 35.1% |
| Immigrants | India | 3.5 /100 | #237 | Tragic 35.0% |
| Immigrants | Vietnam | 3.4 /100 | #238 | Tragic 35.0% |
| Inupiat | 3.2 /100 | #239 | Tragic 35.0% |
| Immigrants | Central America | 3.0 /100 | #240 | Tragic 35.0% |
| Immigrants | Ireland | 2.9 /100 | #241 | Tragic 35.0% |
| Uruguayans | 2.6 /100 | #242 | Tragic 34.9% |
| Pueblo | 2.6 /100 | #243 | Tragic 34.9% |
| Immigrants | Turkey | 2.6 /100 | #244 | Tragic 34.9% |