Immigrants from Iraq vs Immigrants from India Currently Married
COMPARE
Immigrants from Iraq
Immigrants from India
Currently Married
Currently Married Comparison
Immigrants from Iraq
Immigrants from India
47.3%
CURRENTLY MARRIED
82.8/ 100
METRIC RATING
130th/ 347
METRIC RANK
51.8%
CURRENTLY MARRIED
100.0/ 100
METRIC RATING
1st/ 347
METRIC RANK
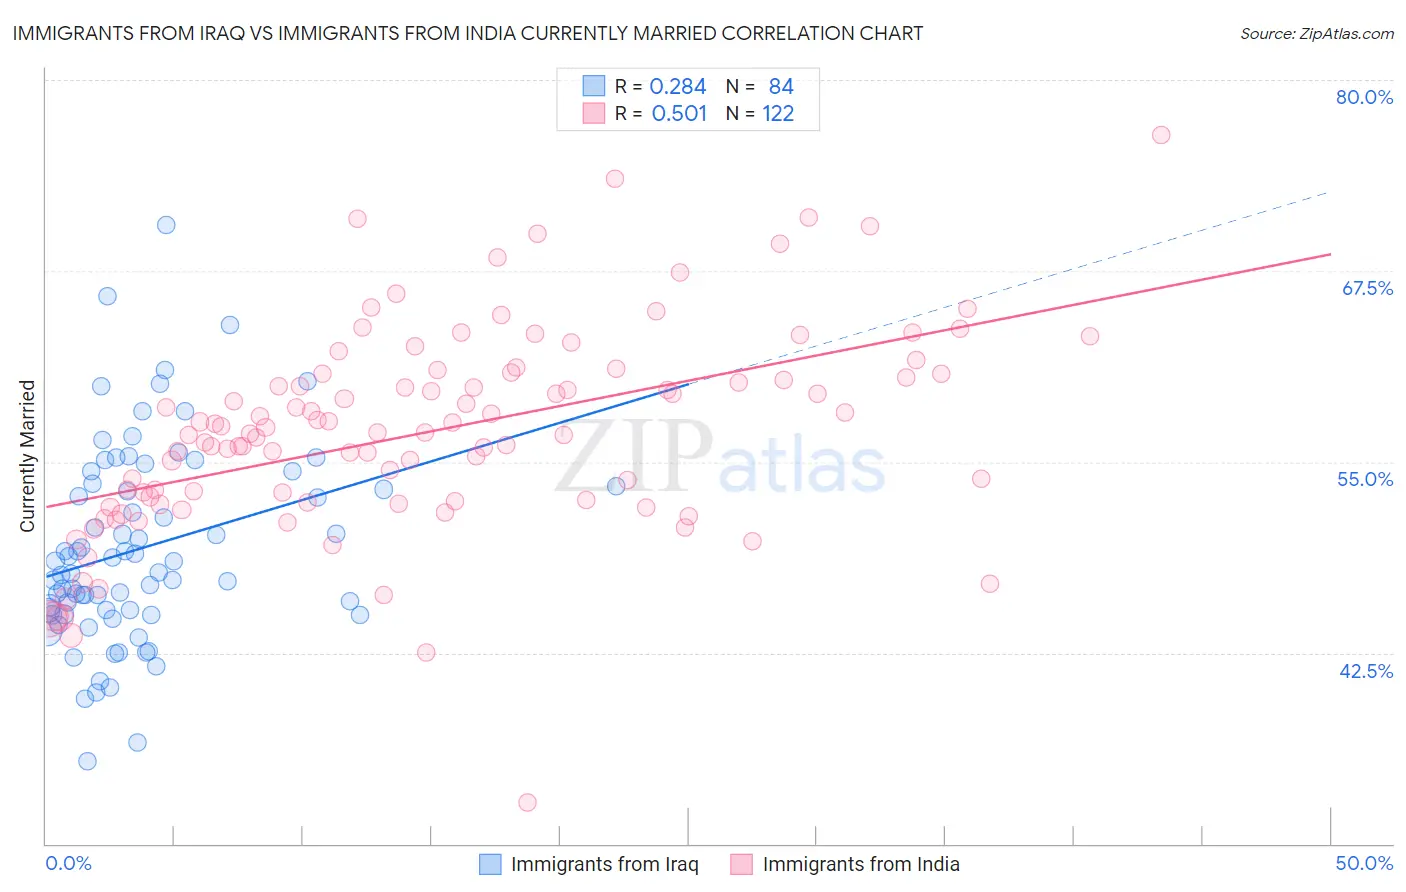
Immigrants from Iraq vs Immigrants from India Currently Married Correlation Chart
The statistical analysis conducted on geographies consisting of 194,780,853 people shows a weak positive correlation between the proportion of Immigrants from Iraq and percentage of population currently married in the United States with a correlation coefficient (R) of 0.284 and weighted average of 47.3%. Similarly, the statistical analysis conducted on geographies consisting of 434,052,762 people shows a substantial positive correlation between the proportion of Immigrants from India and percentage of population currently married in the United States with a correlation coefficient (R) of 0.501 and weighted average of 51.8%, a difference of 9.4%.
Currently Married Correlation Summary
| Measurement | Immigrants from Iraq | Immigrants from India |
| Minimum | 35.4% | 32.7% |
| Maximum | 70.5% | 76.4% |
| Range | 35.1% | 43.7% |
| Mean | 49.3% | 57.0% |
| Median | 48.1% | 56.9% |
| Interquartile 25% (IQ1) | 45.2% | 52.4% |
| Interquartile 75% (IQ3) | 53.5% | 60.7% |
| Interquartile Range (IQR) | 8.3% | 8.3% |
| Standard Deviation (Sample) | 6.5% | 6.8% |
| Standard Deviation (Population) | 6.4% | 6.8% |
Similar Demographics by Currently Married
Demographics Similar to Immigrants from Iraq by Currently Married
In terms of currently married, the demographic groups most similar to Immigrants from Iraq are Icelander (47.3%, a difference of 0.020%), Sri Lankan (47.3%, a difference of 0.030%), Afghan (47.3%, a difference of 0.060%), Portuguese (47.3%, a difference of 0.090%), and Immigrants from Malaysia (47.3%, a difference of 0.10%).
| Demographics | Rating | Rank | Currently Married |
| Immigrants | Kazakhstan | 87.2 /100 | #123 | Excellent 47.4% |
| Laotians | 86.6 /100 | #124 | Excellent 47.4% |
| Okinawans | 85.3 /100 | #125 | Excellent 47.4% |
| Immigrants | Jordan | 84.9 /100 | #126 | Excellent 47.4% |
| New Zealanders | 84.9 /100 | #127 | Excellent 47.4% |
| Portuguese | 84.2 /100 | #128 | Excellent 47.3% |
| Sri Lankans | 83.2 /100 | #129 | Excellent 47.3% |
| Immigrants | Iraq | 82.8 /100 | #130 | Excellent 47.3% |
| Icelanders | 82.4 /100 | #131 | Excellent 47.3% |
| Afghans | 81.8 /100 | #132 | Excellent 47.3% |
| Immigrants | Malaysia | 81.1 /100 | #133 | Excellent 47.3% |
| Immigrants | Australia | 81.1 /100 | #134 | Excellent 47.3% |
| Immigrants | Norway | 79.7 /100 | #135 | Good 47.2% |
| Immigrants | Vietnam | 78.2 /100 | #136 | Good 47.2% |
| Paraguayans | 77.8 /100 | #137 | Good 47.2% |
Demographics Similar to Immigrants from India by Currently Married
In terms of currently married, the demographic groups most similar to Immigrants from India are Thai (50.9%, a difference of 1.8%), Assyrian/Chaldean/Syriac (50.8%, a difference of 1.9%), Immigrants from Taiwan (50.7%, a difference of 2.0%), Danish (50.5%, a difference of 2.6%), and Norwegian (50.2%, a difference of 3.1%).
| Demographics | Rating | Rank | Currently Married |
| Immigrants | India | 100.0 /100 | #1 | Exceptional 51.8% |
| Thais | 100.0 /100 | #2 | Exceptional 50.9% |
| Assyrians/Chaldeans/Syriacs | 100.0 /100 | #3 | Exceptional 50.8% |
| Immigrants | Taiwan | 100.0 /100 | #4 | Exceptional 50.7% |
| Danes | 100.0 /100 | #5 | Exceptional 50.5% |
| Norwegians | 100.0 /100 | #6 | Exceptional 50.2% |
| Immigrants | South Central Asia | 100.0 /100 | #7 | Exceptional 50.0% |
| Swedes | 100.0 /100 | #8 | Exceptional 50.0% |
| Czechs | 99.9 /100 | #9 | Exceptional 49.9% |
| Filipinos | 99.9 /100 | #10 | Exceptional 49.7% |
| English | 99.9 /100 | #11 | Exceptional 49.7% |
| Swiss | 99.9 /100 | #12 | Exceptional 49.7% |
| Dutch | 99.9 /100 | #13 | Exceptional 49.6% |
| Germans | 99.9 /100 | #14 | Exceptional 49.6% |
| Pennsylvania Germans | 99.9 /100 | #15 | Exceptional 49.6% |