Armenian vs Immigrants from South Africa Currently Married
COMPARE
Armenian
Immigrants from South Africa
Currently Married
Currently Married Comparison
Armenians
Immigrants from South Africa
46.8%
CURRENTLY MARRIED
58.2/ 100
METRIC RATING
169th/ 347
METRIC RANK
48.1%
CURRENTLY MARRIED
97.0/ 100
METRIC RATING
79th/ 347
METRIC RANK
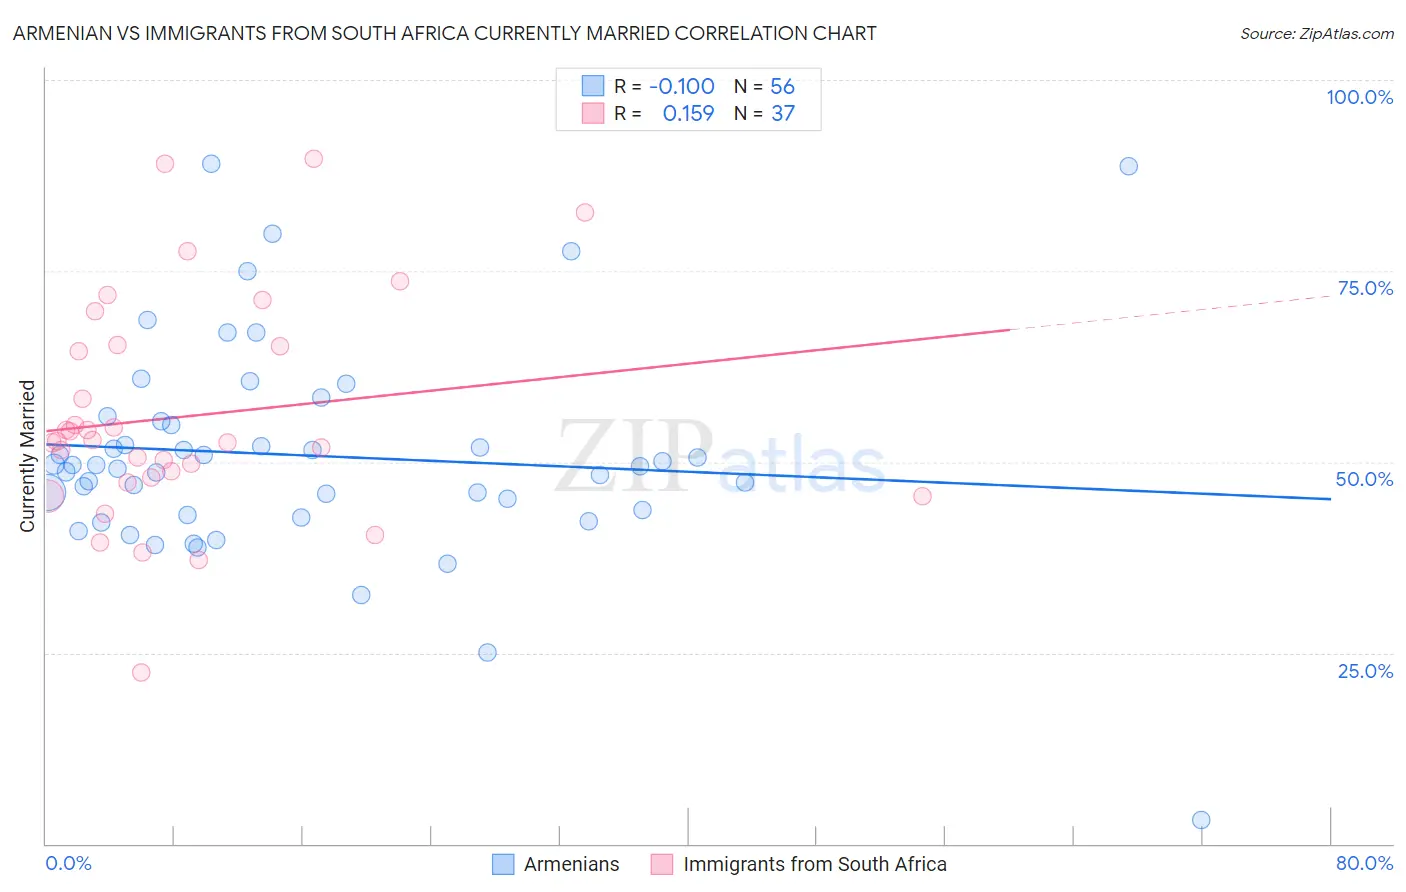
Armenian vs Immigrants from South Africa Currently Married Correlation Chart
The statistical analysis conducted on geographies consisting of 310,938,926 people shows a poor negative correlation between the proportion of Armenians and percentage of population currently married in the United States with a correlation coefficient (R) of -0.100 and weighted average of 46.8%. Similarly, the statistical analysis conducted on geographies consisting of 233,308,336 people shows a poor positive correlation between the proportion of Immigrants from South Africa and percentage of population currently married in the United States with a correlation coefficient (R) of 0.159 and weighted average of 48.1%, a difference of 2.9%.
Currently Married Correlation Summary
| Measurement | Armenian | Immigrants from South Africa |
| Minimum | 3.1% | 22.4% |
| Maximum | 89.1% | 89.7% |
| Range | 86.0% | 67.3% |
| Mean | 50.8% | 55.9% |
| Median | 49.5% | 52.7% |
| Interquartile 25% (IQ1) | 43.4% | 47.6% |
| Interquartile 75% (IQ3) | 55.1% | 65.2% |
| Interquartile Range (IQR) | 11.7% | 17.6% |
| Standard Deviation (Sample) | 14.2% | 14.6% |
| Standard Deviation (Population) | 14.0% | 14.4% |
Similar Demographics by Currently Married
Demographics Similar to Armenians by Currently Married
In terms of currently married, the demographic groups most similar to Armenians are Immigrants from Afghanistan (46.8%, a difference of 0.0%), Spaniard (46.8%, a difference of 0.020%), Immigrants from Syria (46.8%, a difference of 0.040%), Immigrants from Latvia (46.7%, a difference of 0.050%), and Samoan (46.8%, a difference of 0.060%).
| Demographics | Rating | Rank | Currently Married |
| Immigrants | Nonimmigrants | 65.4 /100 | #162 | Good 46.9% |
| Delaware | 64.7 /100 | #163 | Good 46.9% |
| Immigrants | Western Asia | 64.2 /100 | #164 | Good 46.9% |
| Samoans | 59.8 /100 | #165 | Average 46.8% |
| Immigrants | Syria | 59.3 /100 | #166 | Average 46.8% |
| Spaniards | 58.8 /100 | #167 | Average 46.8% |
| Immigrants | Afghanistan | 58.2 /100 | #168 | Average 46.8% |
| Armenians | 58.2 /100 | #169 | Average 46.8% |
| Immigrants | Latvia | 56.7 /100 | #170 | Average 46.7% |
| Immigrants | Zimbabwe | 52.4 /100 | #171 | Average 46.7% |
| Aleuts | 52.0 /100 | #172 | Average 46.7% |
| Tlingit-Haida | 51.2 /100 | #173 | Average 46.7% |
| Peruvians | 50.0 /100 | #174 | Average 46.6% |
| Immigrants | Brazil | 49.9 /100 | #175 | Average 46.6% |
| Hawaiians | 48.6 /100 | #176 | Average 46.6% |
Demographics Similar to Immigrants from South Africa by Currently Married
In terms of currently married, the demographic groups most similar to Immigrants from South Africa are Immigrants from Belgium (48.1%, a difference of 0.010%), Slovene (48.1%, a difference of 0.020%), Immigrants from Poland (48.1%, a difference of 0.030%), Basque (48.1%, a difference of 0.040%), and Immigrants from Sri Lanka (48.1%, a difference of 0.040%).
| Demographics | Rating | Rank | Currently Married |
| Immigrants | Lebanon | 97.6 /100 | #72 | Exceptional 48.2% |
| Immigrants | Eastern Asia | 97.5 /100 | #73 | Exceptional 48.2% |
| Estonians | 97.4 /100 | #74 | Exceptional 48.2% |
| Immigrants | Belarus | 97.2 /100 | #75 | Exceptional 48.1% |
| Basques | 97.2 /100 | #76 | Exceptional 48.1% |
| Slovenes | 97.1 /100 | #77 | Exceptional 48.1% |
| Immigrants | Belgium | 97.1 /100 | #78 | Exceptional 48.1% |
| Immigrants | South Africa | 97.0 /100 | #79 | Exceptional 48.1% |
| Immigrants | Poland | 96.9 /100 | #80 | Exceptional 48.1% |
| Immigrants | Sri Lanka | 96.9 /100 | #81 | Exceptional 48.1% |
| Immigrants | Europe | 96.9 /100 | #82 | Exceptional 48.1% |
| Bolivians | 96.9 /100 | #83 | Exceptional 48.1% |
| Immigrants | Israel | 96.9 /100 | #84 | Exceptional 48.1% |
| French Canadians | 96.3 /100 | #85 | Exceptional 48.0% |
| Immigrants | Japan | 96.2 /100 | #86 | Exceptional 48.0% |