Argentinean vs Pima Average Family Size
COMPARE
Argentinean
Pima
Average Family Size
Average Family Size Comparison
Argentineans
Pima
3.23
AVERAGE FAMILY SIZE
47.4/ 100
METRIC RATING
177th/ 347
METRIC RANK
3.75
AVERAGE FAMILY SIZE
100/ 100
METRIC RATING
4th/ 347
METRIC RANK
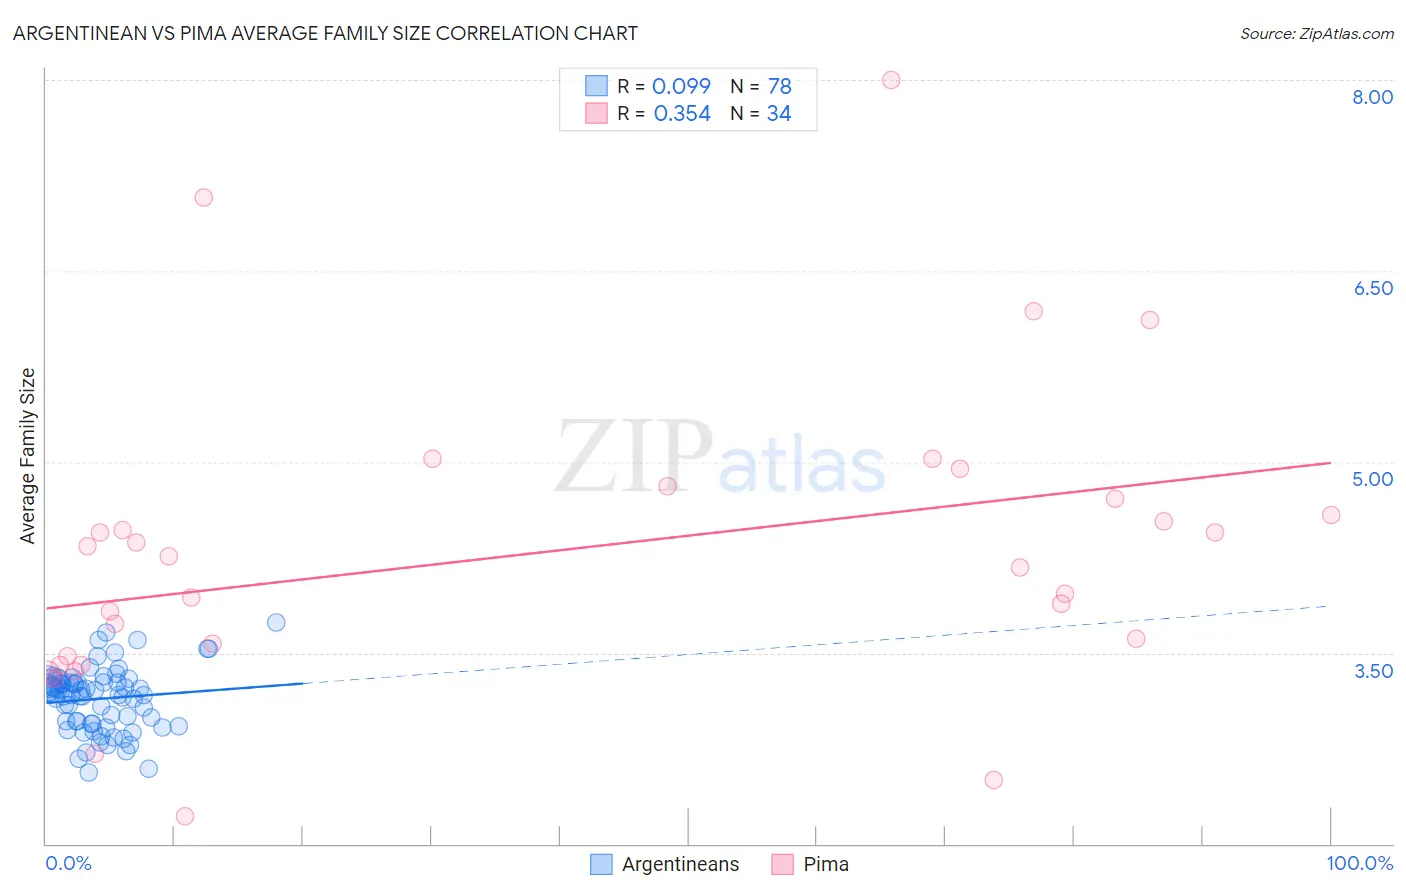
Argentinean vs Pima Average Family Size Correlation Chart
The statistical analysis conducted on geographies consisting of 296,996,433 people shows a slight positive correlation between the proportion of Argentineans and average family size in the United States with a correlation coefficient (R) of 0.099 and weighted average of 3.23. Similarly, the statistical analysis conducted on geographies consisting of 61,539,566 people shows a mild positive correlation between the proportion of Pima and average family size in the United States with a correlation coefficient (R) of 0.354 and weighted average of 3.75, a difference of 16.1%.
Average Family Size Correlation Summary
| Measurement | Argentinean | Pima |
| Minimum | 2.56 | 2.22 |
| Maximum | 3.74 | 8.00 |
| Range | 1.18 | 5.78 |
| Mean | 3.14 | 4.29 |
| Median | 3.19 | 4.21 |
| Interquartile 25% (IQ1) | 2.95 | 3.48 |
| Interquartile 75% (IQ3) | 3.27 | 4.71 |
| Interquartile Range (IQR) | 0.32 | 1.23 |
| Standard Deviation (Sample) | 0.25 | 1.20 |
| Standard Deviation (Population) | 0.25 | 1.18 |
Similar Demographics by Average Family Size
Demographics Similar to Argentineans by Average Family Size
In terms of average family size, the demographic groups most similar to Argentineans are Spaniard (3.23, a difference of 0.0%), Immigrants from Korea (3.23, a difference of 0.010%), Palestinian (3.23, a difference of 0.010%), Israeli (3.23, a difference of 0.020%), and Immigrants from South Central Asia (3.23, a difference of 0.050%).
| Demographics | Rating | Rank | Average Family Size |
| Arabs | 53.8 /100 | #170 | Average 3.23 |
| Chileans | 53.2 /100 | #171 | Average 3.23 |
| Immigrants | Congo | 52.7 /100 | #172 | Average 3.23 |
| Immigrants | Uruguay | 52.0 /100 | #173 | Average 3.23 |
| Immigrants | South Central Asia | 50.0 /100 | #174 | Average 3.23 |
| Immigrants | China | 49.9 /100 | #175 | Average 3.23 |
| Israelis | 48.7 /100 | #176 | Average 3.23 |
| Argentineans | 47.4 /100 | #177 | Average 3.23 |
| Spaniards | 47.2 /100 | #178 | Average 3.23 |
| Immigrants | Korea | 46.9 /100 | #179 | Average 3.23 |
| Palestinians | 46.6 /100 | #180 | Average 3.23 |
| Spanish | 44.8 /100 | #181 | Average 3.23 |
| Moroccans | 44.2 /100 | #182 | Average 3.22 |
| Immigrants | Northern Africa | 41.7 /100 | #183 | Average 3.22 |
| Immigrants | Eastern Asia | 40.8 /100 | #184 | Average 3.22 |
Demographics Similar to Pima by Average Family Size
In terms of average family size, the demographic groups most similar to Pima are Pueblo (3.79, a difference of 1.3%), Crow (3.82, a difference of 2.1%), Navajo (3.65, a difference of 2.8%), Arapaho (3.64, a difference of 3.1%), and Inupiat (3.63, a difference of 3.3%).
| Demographics | Rating | Rank | Average Family Size |
| Yup'ik | 100 /100 | #1 | Exceptional 4.00 |
| Crow | 100 /100 | #2 | Exceptional 3.82 |
| Pueblo | 100 /100 | #3 | Exceptional 3.79 |
| Pima | 100 /100 | #4 | Exceptional 3.75 |
| Navajo | 100.0 /100 | #5 | Exceptional 3.65 |
| Arapaho | 100.0 /100 | #6 | Exceptional 3.64 |
| Inupiat | 100.0 /100 | #7 | Exceptional 3.63 |
| Immigrants | Yemen | 100.0 /100 | #8 | Exceptional 3.60 |
| Hopi | 100.0 /100 | #9 | Exceptional 3.60 |
| Spanish American Indians | 100.0 /100 | #10 | Exceptional 3.58 |
| Tohono O'odham | 100.0 /100 | #11 | Exceptional 3.53 |
| Immigrants | Mexico | 100.0 /100 | #12 | Exceptional 3.52 |
| Sioux | 100.0 /100 | #13 | Exceptional 3.52 |
| Immigrants | Central America | 100.0 /100 | #14 | Exceptional 3.49 |
| Tongans | 100.0 /100 | #15 | Exceptional 3.49 |