Argentinean vs Houma Average Family Size
COMPARE
Argentinean
Houma
Average Family Size
Average Family Size Comparison
Argentineans
Houma
3.23
AVERAGE FAMILY SIZE
47.4/ 100
METRIC RATING
177th/ 347
METRIC RANK
3.18
AVERAGE FAMILY SIZE
3.4/ 100
METRIC RATING
239th/ 347
METRIC RANK
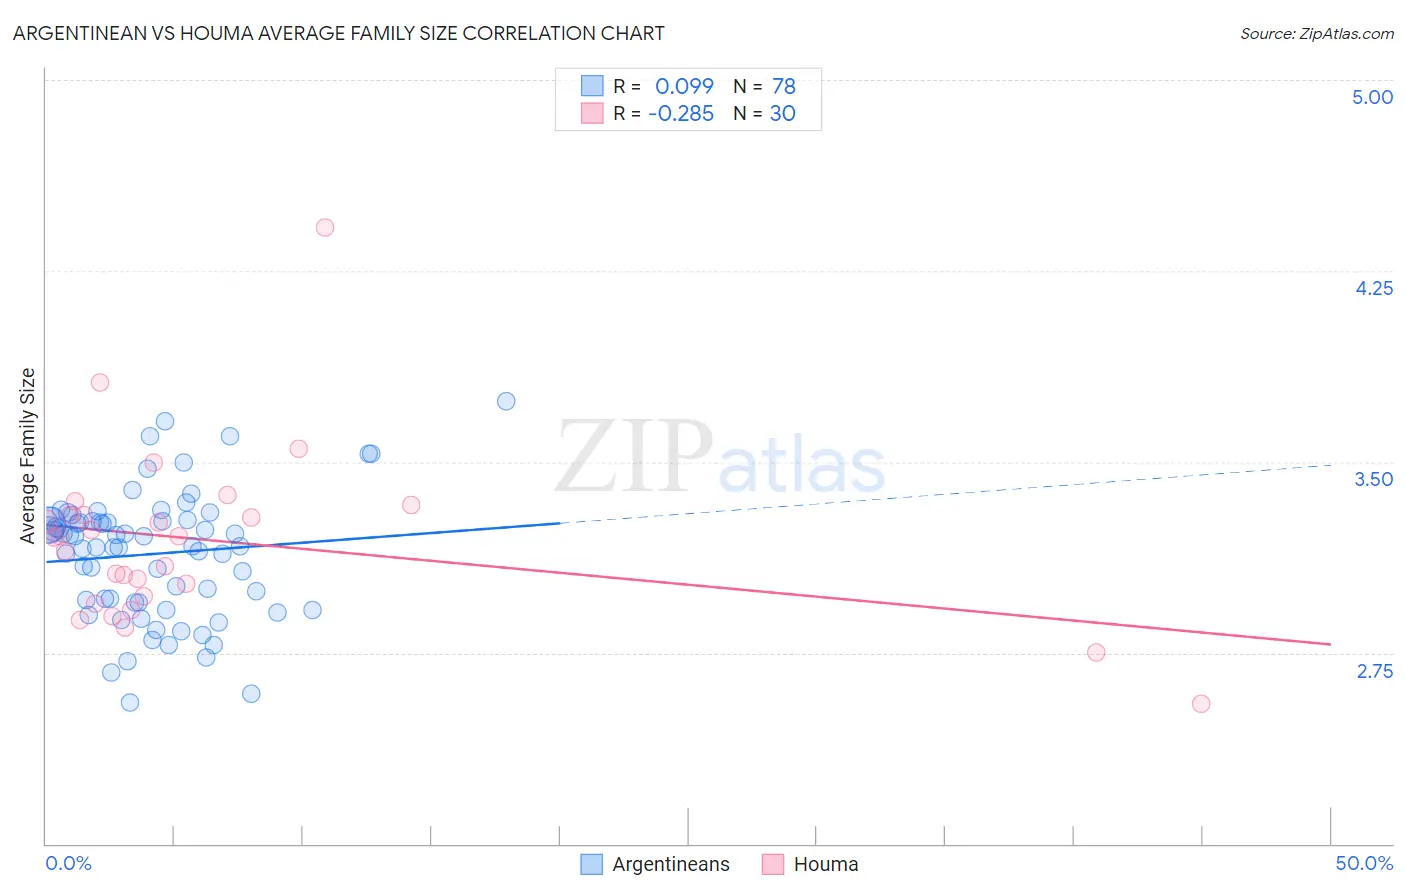
Argentinean vs Houma Average Family Size Correlation Chart
The statistical analysis conducted on geographies consisting of 296,996,433 people shows a slight positive correlation between the proportion of Argentineans and average family size in the United States with a correlation coefficient (R) of 0.099 and weighted average of 3.23. Similarly, the statistical analysis conducted on geographies consisting of 36,793,313 people shows a weak negative correlation between the proportion of Houma and average family size in the United States with a correlation coefficient (R) of -0.285 and weighted average of 3.18, a difference of 1.5%.
Average Family Size Correlation Summary
| Measurement | Argentinean | Houma |
| Minimum | 2.56 | 2.55 |
| Maximum | 3.74 | 4.42 |
| Range | 1.18 | 1.87 |
| Mean | 3.14 | 3.19 |
| Median | 3.19 | 3.20 |
| Interquartile 25% (IQ1) | 2.95 | 2.97 |
| Interquartile 75% (IQ3) | 3.27 | 3.29 |
| Interquartile Range (IQR) | 0.32 | 0.32 |
| Standard Deviation (Sample) | 0.25 | 0.34 |
| Standard Deviation (Population) | 0.25 | 0.34 |
Similar Demographics by Average Family Size
Demographics Similar to Argentineans by Average Family Size
In terms of average family size, the demographic groups most similar to Argentineans are Spaniard (3.23, a difference of 0.0%), Immigrants from Korea (3.23, a difference of 0.010%), Palestinian (3.23, a difference of 0.010%), Israeli (3.23, a difference of 0.020%), and Immigrants from South Central Asia (3.23, a difference of 0.050%).
| Demographics | Rating | Rank | Average Family Size |
| Arabs | 53.8 /100 | #170 | Average 3.23 |
| Chileans | 53.2 /100 | #171 | Average 3.23 |
| Immigrants | Congo | 52.7 /100 | #172 | Average 3.23 |
| Immigrants | Uruguay | 52.0 /100 | #173 | Average 3.23 |
| Immigrants | South Central Asia | 50.0 /100 | #174 | Average 3.23 |
| Immigrants | China | 49.9 /100 | #175 | Average 3.23 |
| Israelis | 48.7 /100 | #176 | Average 3.23 |
| Argentineans | 47.4 /100 | #177 | Average 3.23 |
| Spaniards | 47.2 /100 | #178 | Average 3.23 |
| Immigrants | Korea | 46.9 /100 | #179 | Average 3.23 |
| Palestinians | 46.6 /100 | #180 | Average 3.23 |
| Spanish | 44.8 /100 | #181 | Average 3.23 |
| Moroccans | 44.2 /100 | #182 | Average 3.22 |
| Immigrants | Northern Africa | 41.7 /100 | #183 | Average 3.22 |
| Immigrants | Eastern Asia | 40.8 /100 | #184 | Average 3.22 |
Demographics Similar to Houma by Average Family Size
In terms of average family size, the demographic groups most similar to Houma are Osage (3.18, a difference of 0.020%), Immigrants from Romania (3.18, a difference of 0.050%), Romanian (3.18, a difference of 0.050%), Immigrants from Japan (3.18, a difference of 0.050%), and Hungarian (3.18, a difference of 0.060%).
| Demographics | Rating | Rank | Average Family Size |
| Cherokee | 4.7 /100 | #232 | Tragic 3.18 |
| Brazilians | 4.5 /100 | #233 | Tragic 3.18 |
| Iranians | 4.5 /100 | #234 | Tragic 3.18 |
| Immigrants | Turkey | 4.2 /100 | #235 | Tragic 3.18 |
| Immigrants | Portugal | 4.2 /100 | #236 | Tragic 3.18 |
| Immigrants | Romania | 3.7 /100 | #237 | Tragic 3.18 |
| Romanians | 3.7 /100 | #238 | Tragic 3.18 |
| Houma | 3.4 /100 | #239 | Tragic 3.18 |
| Osage | 3.2 /100 | #240 | Tragic 3.18 |
| Immigrants | Japan | 3.0 /100 | #241 | Tragic 3.18 |
| Hungarians | 3.0 /100 | #242 | Tragic 3.18 |
| Immigrants | Moldova | 2.9 /100 | #243 | Tragic 3.18 |
| Immigrants | Southern Europe | 2.9 /100 | #244 | Tragic 3.18 |
| Immigrants | Brazil | 2.7 /100 | #245 | Tragic 3.18 |
| Danes | 2.5 /100 | #246 | Tragic 3.17 |