Argentinean vs African Average Family Size
COMPARE
Argentinean
African
Average Family Size
Average Family Size Comparison
Argentineans
Africans
3.23
AVERAGE FAMILY SIZE
47.4/ 100
METRIC RATING
177th/ 347
METRIC RANK
3.25
AVERAGE FAMILY SIZE
84.9/ 100
METRIC RATING
134th/ 347
METRIC RANK
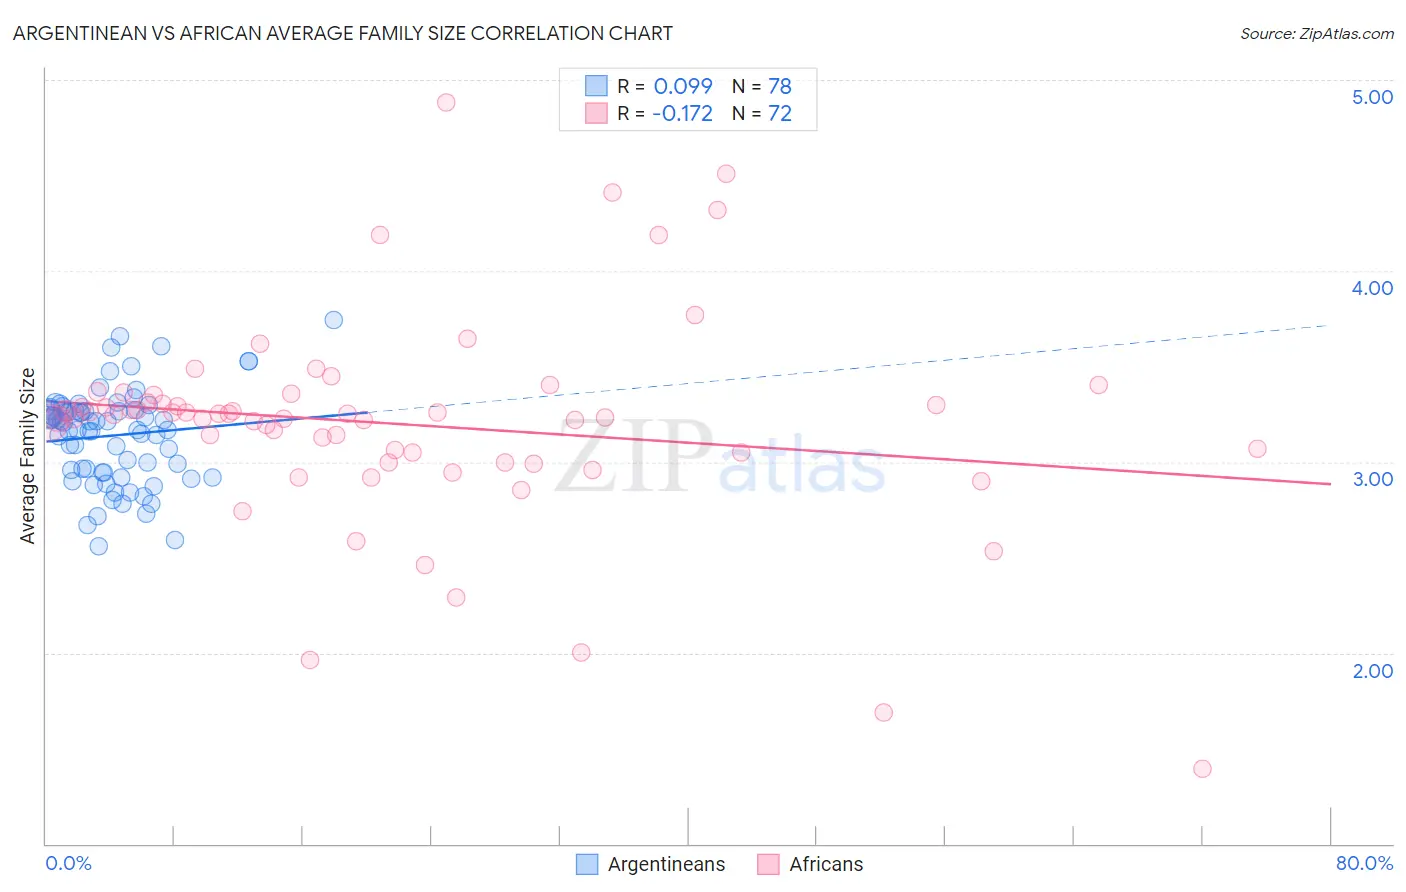
Argentinean vs African Average Family Size Correlation Chart
The statistical analysis conducted on geographies consisting of 296,996,433 people shows a slight positive correlation between the proportion of Argentineans and average family size in the United States with a correlation coefficient (R) of 0.099 and weighted average of 3.23. Similarly, the statistical analysis conducted on geographies consisting of 469,598,302 people shows a poor negative correlation between the proportion of Africans and average family size in the United States with a correlation coefficient (R) of -0.172 and weighted average of 3.25, a difference of 0.83%.
Average Family Size Correlation Summary
| Measurement | Argentinean | African |
| Minimum | 2.56 | 1.39 |
| Maximum | 3.74 | 4.88 |
| Range | 1.18 | 3.49 |
| Mean | 3.14 | 3.20 |
| Median | 3.19 | 3.24 |
| Interquartile 25% (IQ1) | 2.95 | 3.02 |
| Interquartile 75% (IQ3) | 3.27 | 3.33 |
| Interquartile Range (IQR) | 0.32 | 0.31 |
| Standard Deviation (Sample) | 0.25 | 0.56 |
| Standard Deviation (Population) | 0.25 | 0.55 |
Similar Demographics by Average Family Size
Demographics Similar to Argentineans by Average Family Size
In terms of average family size, the demographic groups most similar to Argentineans are Spaniard (3.23, a difference of 0.0%), Immigrants from Korea (3.23, a difference of 0.010%), Palestinian (3.23, a difference of 0.010%), Israeli (3.23, a difference of 0.020%), and Immigrants from South Central Asia (3.23, a difference of 0.050%).
| Demographics | Rating | Rank | Average Family Size |
| Arabs | 53.8 /100 | #170 | Average 3.23 |
| Chileans | 53.2 /100 | #171 | Average 3.23 |
| Immigrants | Congo | 52.7 /100 | #172 | Average 3.23 |
| Immigrants | Uruguay | 52.0 /100 | #173 | Average 3.23 |
| Immigrants | South Central Asia | 50.0 /100 | #174 | Average 3.23 |
| Immigrants | China | 49.9 /100 | #175 | Average 3.23 |
| Israelis | 48.7 /100 | #176 | Average 3.23 |
| Argentineans | 47.4 /100 | #177 | Average 3.23 |
| Spaniards | 47.2 /100 | #178 | Average 3.23 |
| Immigrants | Korea | 46.9 /100 | #179 | Average 3.23 |
| Palestinians | 46.6 /100 | #180 | Average 3.23 |
| Spanish | 44.8 /100 | #181 | Average 3.23 |
| Moroccans | 44.2 /100 | #182 | Average 3.22 |
| Immigrants | Northern Africa | 41.7 /100 | #183 | Average 3.22 |
| Immigrants | Eastern Asia | 40.8 /100 | #184 | Average 3.22 |
Demographics Similar to Africans by Average Family Size
In terms of average family size, the demographic groups most similar to Africans are Panamanian (3.25, a difference of 0.020%), Immigrants from Venezuela (3.26, a difference of 0.050%), Costa Rican (3.26, a difference of 0.070%), Comanche (3.25, a difference of 0.070%), and Immigrants from Middle Africa (3.25, a difference of 0.080%).
| Demographics | Rating | Rank | Average Family Size |
| Immigrants | Syria | 90.6 /100 | #127 | Exceptional 3.26 |
| Colombians | 89.9 /100 | #128 | Excellent 3.26 |
| Immigrants | Hong Kong | 88.6 /100 | #129 | Excellent 3.26 |
| Laotians | 88.5 /100 | #130 | Excellent 3.26 |
| Immigrants | Western Asia | 87.7 /100 | #131 | Excellent 3.26 |
| Costa Ricans | 86.8 /100 | #132 | Excellent 3.26 |
| Immigrants | Venezuela | 86.3 /100 | #133 | Excellent 3.26 |
| Africans | 84.9 /100 | #134 | Excellent 3.25 |
| Panamanians | 84.2 /100 | #135 | Excellent 3.25 |
| Comanche | 82.8 /100 | #136 | Excellent 3.25 |
| Immigrants | Middle Africa | 82.4 /100 | #137 | Excellent 3.25 |
| Cubans | 81.8 /100 | #138 | Excellent 3.25 |
| Immigrants | Ethiopia | 81.6 /100 | #139 | Excellent 3.25 |
| Sub-Saharan Africans | 81.6 /100 | #140 | Excellent 3.25 |
| Venezuelans | 81.4 /100 | #141 | Excellent 3.25 |