Argentinean vs Immigrants from Lithuania Average Family Size
COMPARE
Argentinean
Immigrants from Lithuania
Average Family Size
Average Family Size Comparison
Argentineans
Immigrants from Lithuania
3.23
AVERAGE FAMILY SIZE
47.4/ 100
METRIC RATING
177th/ 347
METRIC RANK
3.15
AVERAGE FAMILY SIZE
0.6/ 100
METRIC RATING
272nd/ 347
METRIC RANK
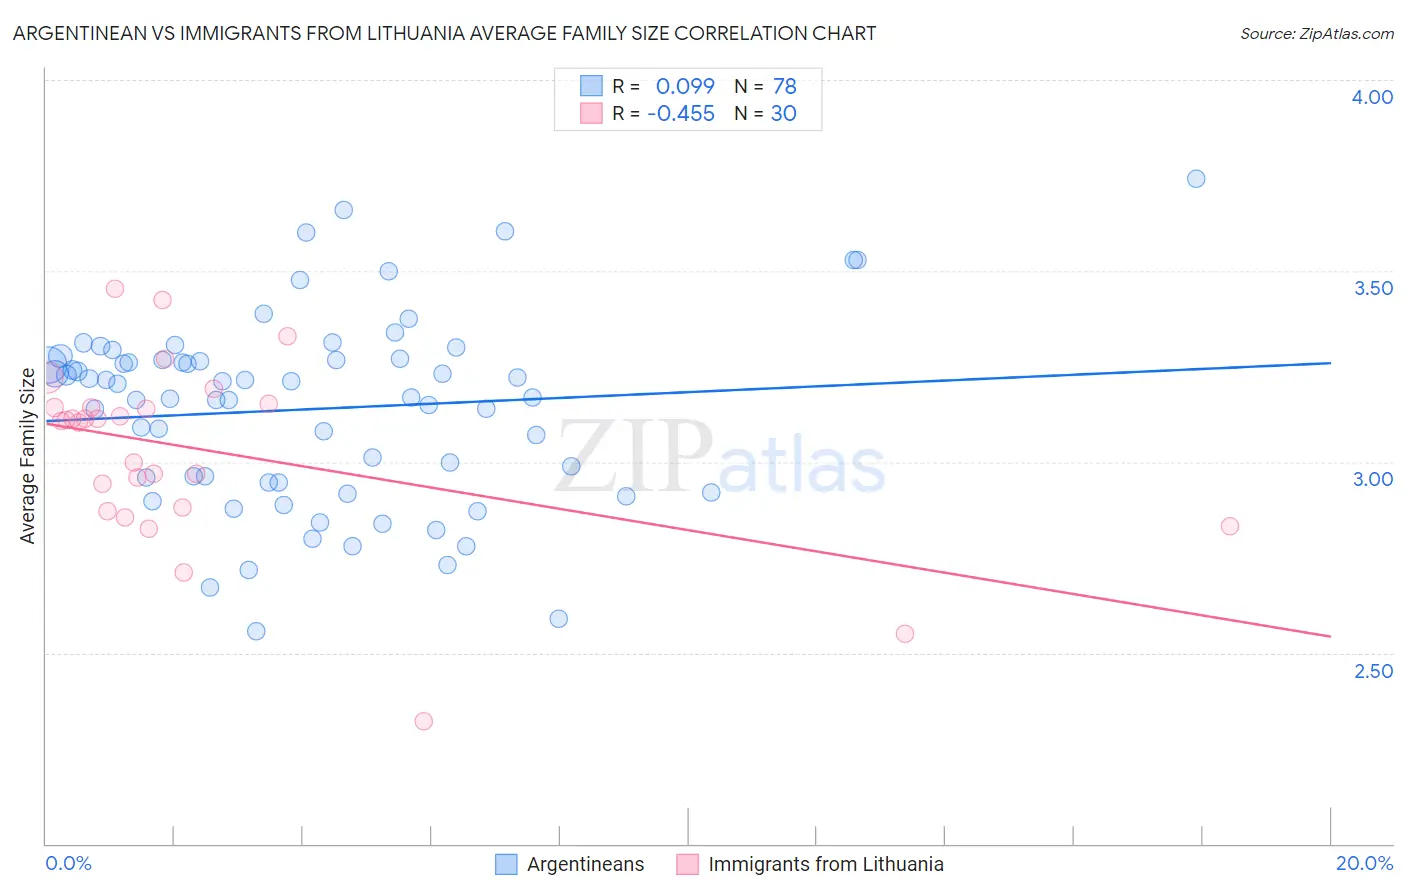
Argentinean vs Immigrants from Lithuania Average Family Size Correlation Chart
The statistical analysis conducted on geographies consisting of 296,996,433 people shows a slight positive correlation between the proportion of Argentineans and average family size in the United States with a correlation coefficient (R) of 0.099 and weighted average of 3.23. Similarly, the statistical analysis conducted on geographies consisting of 117,713,976 people shows a moderate negative correlation between the proportion of Immigrants from Lithuania and average family size in the United States with a correlation coefficient (R) of -0.455 and weighted average of 3.15, a difference of 2.3%.
Average Family Size Correlation Summary
| Measurement | Argentinean | Immigrants from Lithuania |
| Minimum | 2.56 | 2.32 |
| Maximum | 3.74 | 3.45 |
| Range | 1.18 | 1.13 |
| Mean | 3.14 | 3.03 |
| Median | 3.19 | 3.11 |
| Interquartile 25% (IQ1) | 2.95 | 2.88 |
| Interquartile 75% (IQ3) | 3.27 | 3.14 |
| Interquartile Range (IQR) | 0.32 | 0.26 |
| Standard Deviation (Sample) | 0.25 | 0.24 |
| Standard Deviation (Population) | 0.25 | 0.24 |
Similar Demographics by Average Family Size
Demographics Similar to Argentineans by Average Family Size
In terms of average family size, the demographic groups most similar to Argentineans are Spaniard (3.23, a difference of 0.0%), Immigrants from Korea (3.23, a difference of 0.010%), Palestinian (3.23, a difference of 0.010%), Israeli (3.23, a difference of 0.020%), and Immigrants from South Central Asia (3.23, a difference of 0.050%).
| Demographics | Rating | Rank | Average Family Size |
| Arabs | 53.8 /100 | #170 | Average 3.23 |
| Chileans | 53.2 /100 | #171 | Average 3.23 |
| Immigrants | Congo | 52.7 /100 | #172 | Average 3.23 |
| Immigrants | Uruguay | 52.0 /100 | #173 | Average 3.23 |
| Immigrants | South Central Asia | 50.0 /100 | #174 | Average 3.23 |
| Immigrants | China | 49.9 /100 | #175 | Average 3.23 |
| Israelis | 48.7 /100 | #176 | Average 3.23 |
| Argentineans | 47.4 /100 | #177 | Average 3.23 |
| Spaniards | 47.2 /100 | #178 | Average 3.23 |
| Immigrants | Korea | 46.9 /100 | #179 | Average 3.23 |
| Palestinians | 46.6 /100 | #180 | Average 3.23 |
| Spanish | 44.8 /100 | #181 | Average 3.23 |
| Moroccans | 44.2 /100 | #182 | Average 3.22 |
| Immigrants | Northern Africa | 41.7 /100 | #183 | Average 3.22 |
| Immigrants | Eastern Asia | 40.8 /100 | #184 | Average 3.22 |
Demographics Similar to Immigrants from Lithuania by Average Family Size
In terms of average family size, the demographic groups most similar to Immigrants from Lithuania are New Zealander (3.15, a difference of 0.010%), Immigrants from Germany (3.15, a difference of 0.020%), Immigrants from Belgium (3.15, a difference of 0.020%), Cambodian (3.15, a difference of 0.020%), and Tlingit-Haida (3.16, a difference of 0.040%).
| Demographics | Rating | Rank | Average Family Size |
| Immigrants | South Africa | 0.9 /100 | #265 | Tragic 3.16 |
| Immigrants | Greece | 0.9 /100 | #266 | Tragic 3.16 |
| Iroquois | 0.8 /100 | #267 | Tragic 3.16 |
| Maltese | 0.8 /100 | #268 | Tragic 3.16 |
| Immigrants | Singapore | 0.7 /100 | #269 | Tragic 3.16 |
| Tlingit-Haida | 0.7 /100 | #270 | Tragic 3.16 |
| Immigrants | Germany | 0.7 /100 | #271 | Tragic 3.15 |
| Immigrants | Lithuania | 0.6 /100 | #272 | Tragic 3.15 |
| New Zealanders | 0.6 /100 | #273 | Tragic 3.15 |
| Immigrants | Belgium | 0.6 /100 | #274 | Tragic 3.15 |
| Cambodians | 0.6 /100 | #275 | Tragic 3.15 |
| Immigrants | Bosnia and Herzegovina | 0.5 /100 | #276 | Tragic 3.15 |
| Swiss | 0.5 /100 | #277 | Tragic 3.15 |
| Okinawans | 0.5 /100 | #278 | Tragic 3.15 |
| Immigrants | Europe | 0.5 /100 | #279 | Tragic 3.15 |