Argentinean vs South African Householder Income Ages 25 - 44 years
COMPARE
Argentinean
South African
Householder Income Ages 25 - 44 years
Householder Income Ages 25 - 44 years Comparison
Argentineans
South Africans
$103,111
HOUSEHOLDER INCOME AGES 25 - 44 YEARS
99.1/ 100
METRIC RATING
83rd/ 347
METRIC RANK
$103,160
HOUSEHOLDER INCOME AGES 25 - 44 YEARS
99.2/ 100
METRIC RATING
81st/ 347
METRIC RANK
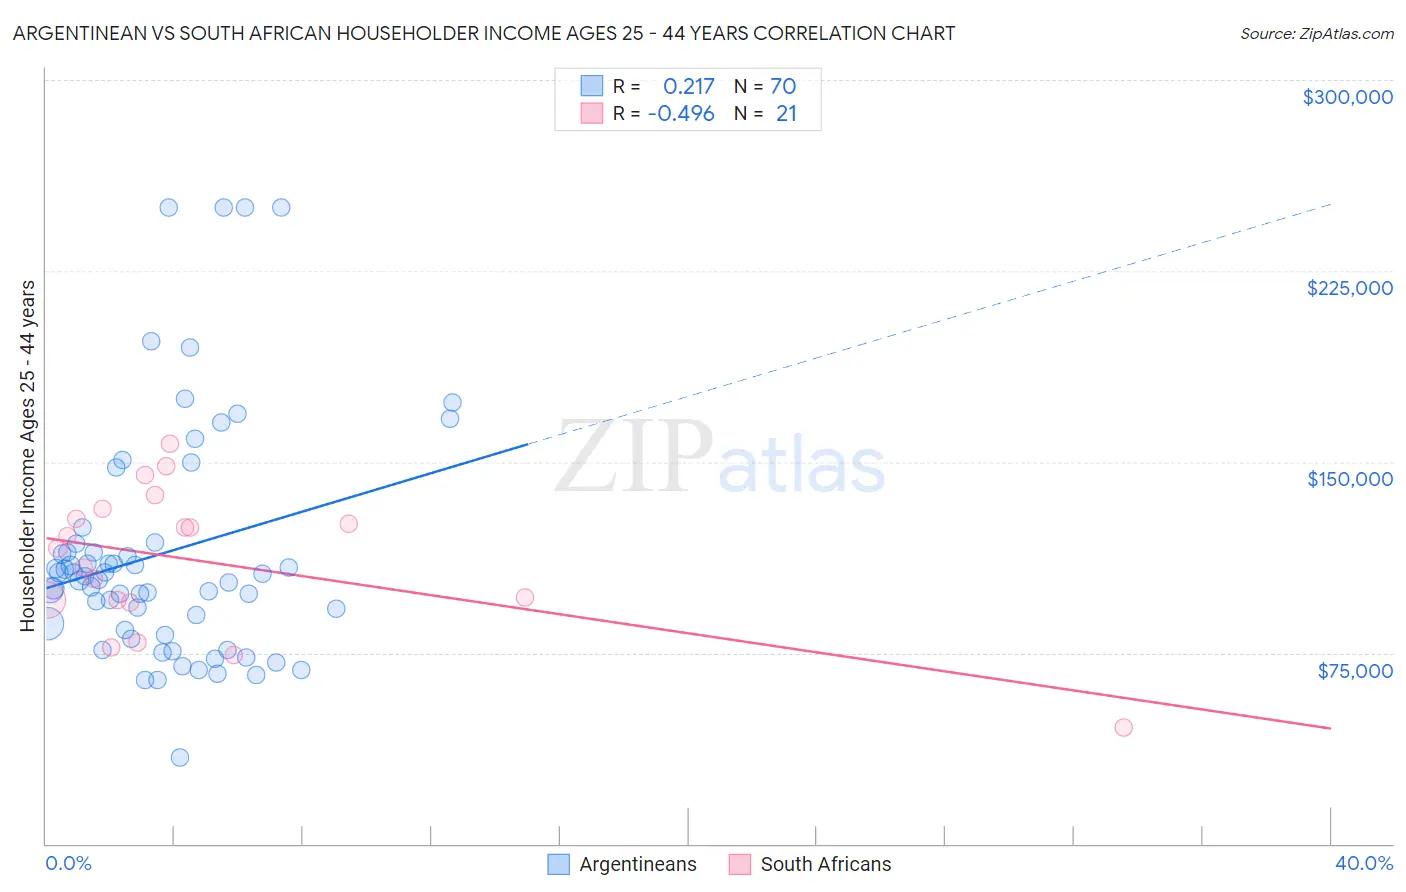
Argentinean vs South African Householder Income Ages 25 - 44 years Correlation Chart
The statistical analysis conducted on geographies consisting of 296,719,437 people shows a weak positive correlation between the proportion of Argentineans and household income with householder between the ages 25 and 44 in the United States with a correlation coefficient (R) of 0.217 and weighted average of $103,111. Similarly, the statistical analysis conducted on geographies consisting of 182,377,934 people shows a moderate negative correlation between the proportion of South Africans and household income with householder between the ages 25 and 44 in the United States with a correlation coefficient (R) of -0.496 and weighted average of $103,160, a difference of 0.050%.
Householder Income Ages 25 - 44 years Correlation Summary
| Measurement | Argentinean | South African |
| Minimum | $33,750 | $45,714 |
| Maximum | $250,001 | $156,974 |
| Range | $216,251 | $111,260 |
| Mean | $114,200 | $110,921 |
| Median | $104,423 | $115,903 |
| Interquartile 25% (IQ1) | $84,111 | $95,265 |
| Interquartile 75% (IQ3) | $117,920 | $129,677 |
| Interquartile Range (IQR) | $33,809 | $34,411 |
| Standard Deviation (Sample) | $46,765 | $27,826 |
| Standard Deviation (Population) | $46,430 | $27,156 |
Demographics Similar to Argentineans and South Africans by Householder Income Ages 25 - 44 years
In terms of householder income ages 25 - 44 years, the demographic groups most similar to Argentineans are Immigrants from Serbia ($103,155, a difference of 0.040%), Immigrants from Egypt ($103,192, a difference of 0.080%), Armenian ($103,248, a difference of 0.13%), Immigrants from Philippines ($102,910, a difference of 0.20%), and Immigrants from Bulgaria ($103,423, a difference of 0.30%). Similarly, the demographic groups most similar to South Africans are Immigrants from Serbia ($103,155, a difference of 0.010%), Immigrants from Egypt ($103,192, a difference of 0.030%), Armenian ($103,248, a difference of 0.080%), Immigrants from Philippines ($102,910, a difference of 0.24%), and Immigrants from Bulgaria ($103,423, a difference of 0.25%).
| Demographics | Rating | Rank | Householder Income Ages 25 - 44 years |
| Chinese | 99.5 /100 | #72 | Exceptional $104,264 |
| Italians | 99.5 /100 | #73 | Exceptional $104,215 |
| Immigrants | Fiji | 99.5 /100 | #74 | Exceptional $103,954 |
| Koreans | 99.4 /100 | #75 | Exceptional $103,824 |
| Immigrants | Spain | 99.4 /100 | #76 | Exceptional $103,752 |
| Immigrants | Southern Europe | 99.3 /100 | #77 | Exceptional $103,486 |
| Immigrants | Bulgaria | 99.3 /100 | #78 | Exceptional $103,423 |
| Armenians | 99.2 /100 | #79 | Exceptional $103,248 |
| Immigrants | Egypt | 99.2 /100 | #80 | Exceptional $103,192 |
| South Africans | 99.2 /100 | #81 | Exceptional $103,160 |
| Immigrants | Serbia | 99.2 /100 | #82 | Exceptional $103,155 |
| Argentineans | 99.1 /100 | #83 | Exceptional $103,111 |
| Immigrants | Philippines | 99.0 /100 | #84 | Exceptional $102,910 |
| Immigrants | Ukraine | 98.9 /100 | #85 | Exceptional $102,664 |
| Immigrants | Hungary | 98.9 /100 | #86 | Exceptional $102,655 |
| Immigrants | Western Europe | 98.9 /100 | #87 | Exceptional $102,654 |
| Immigrants | Canada | 98.9 /100 | #88 | Exceptional $102,616 |
| Romanians | 98.8 /100 | #89 | Exceptional $102,544 |
| Ukrainians | 98.8 /100 | #90 | Exceptional $102,451 |
| Croatians | 98.7 /100 | #91 | Exceptional $102,414 |
| Immigrants | North America | 98.7 /100 | #92 | Exceptional $102,407 |