Arab vs Immigrants from Ecuador Family Households
COMPARE
Arab
Immigrants from Ecuador
Family Households
Family Households Comparison
Arabs
Immigrants from Ecuador
64.1%
FAMILY HOUSEHOLDS
24.5/ 100
METRIC RATING
191st/ 347
METRIC RANK
64.8%
FAMILY HOUSEHOLDS
91.4/ 100
METRIC RATING
129th/ 347
METRIC RANK
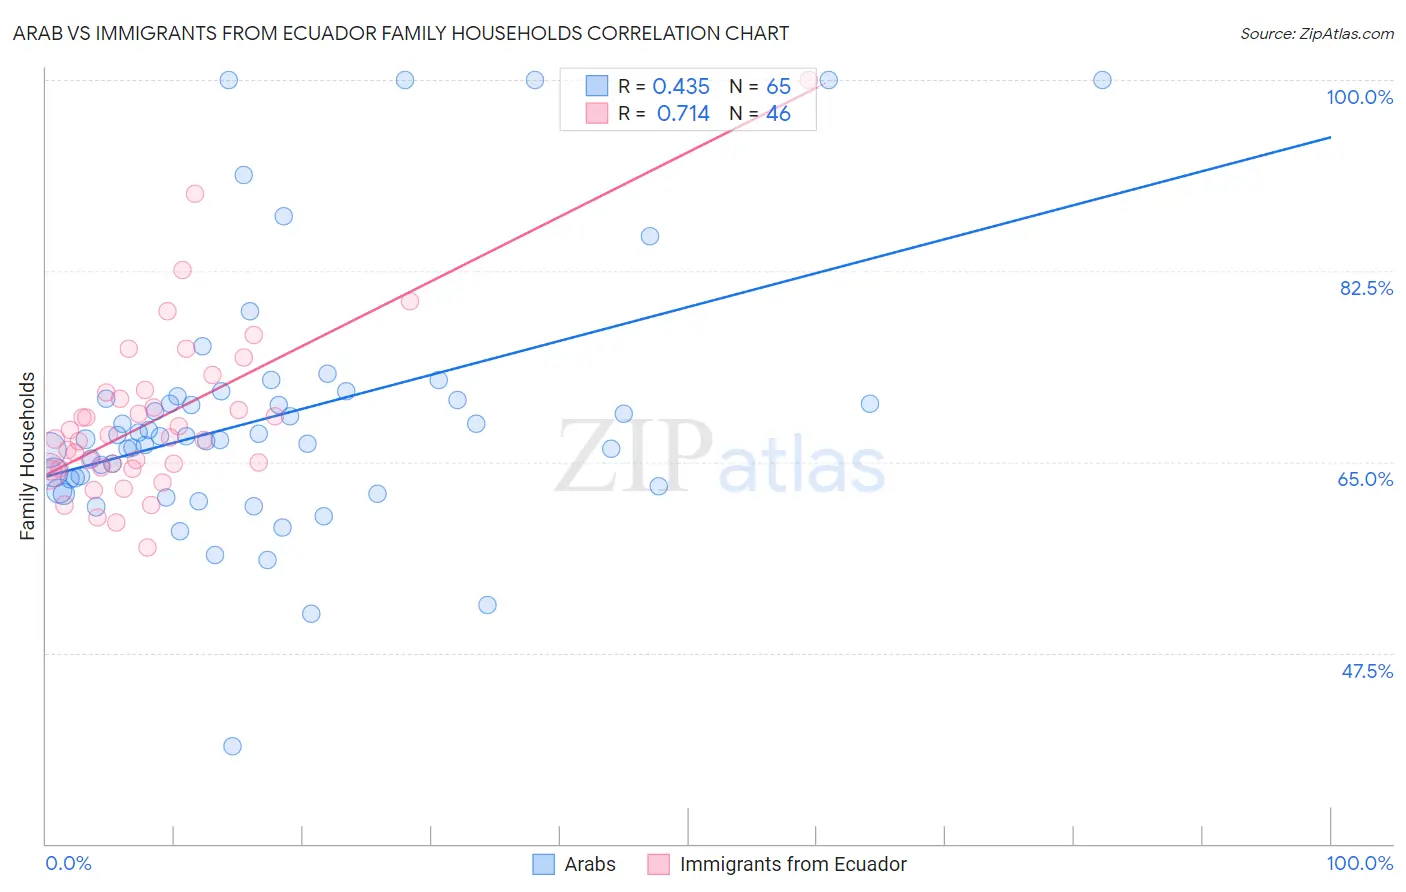
Arab vs Immigrants from Ecuador Family Households Correlation Chart
The statistical analysis conducted on geographies consisting of 486,389,490 people shows a moderate positive correlation between the proportion of Arabs and percentage of family households in the United States with a correlation coefficient (R) of 0.435 and weighted average of 64.1%. Similarly, the statistical analysis conducted on geographies consisting of 270,888,190 people shows a strong positive correlation between the proportion of Immigrants from Ecuador and percentage of family households in the United States with a correlation coefficient (R) of 0.714 and weighted average of 64.8%, a difference of 1.2%.
Family Households Correlation Summary
| Measurement | Arab | Immigrants from Ecuador |
| Minimum | 38.9% | 57.2% |
| Maximum | 100.0% | 100.0% |
| Range | 61.1% | 42.8% |
| Mean | 69.2% | 69.0% |
| Median | 67.3% | 67.2% |
| Interquartile 25% (IQ1) | 63.1% | 64.4% |
| Interquartile 75% (IQ3) | 70.9% | 71.4% |
| Interquartile Range (IQR) | 7.8% | 7.0% |
| Standard Deviation (Sample) | 11.8% | 7.8% |
| Standard Deviation (Population) | 11.7% | 7.8% |
Similar Demographics by Family Households
Demographics Similar to Arabs by Family Households
In terms of family households, the demographic groups most similar to Arabs are Zimbabwean (64.1%, a difference of 0.0%), Lithuanian (64.0%, a difference of 0.010%), French (64.0%, a difference of 0.010%), Immigrants from Western Asia (64.1%, a difference of 0.020%), and Paraguayan (64.1%, a difference of 0.040%).
| Demographics | Rating | Rank | Family Households |
| Puerto Ricans | 33.4 /100 | #184 | Fair 64.2% |
| Immigrants | Iran | 30.4 /100 | #185 | Fair 64.1% |
| Spanish Americans | 30.1 /100 | #186 | Fair 64.1% |
| Northern Europeans | 28.2 /100 | #187 | Fair 64.1% |
| Paraguayans | 26.7 /100 | #188 | Fair 64.1% |
| Immigrants | Western Asia | 25.3 /100 | #189 | Fair 64.1% |
| Zimbabweans | 24.7 /100 | #190 | Fair 64.1% |
| Arabs | 24.5 /100 | #191 | Fair 64.1% |
| Lithuanians | 23.8 /100 | #192 | Fair 64.0% |
| French | 23.7 /100 | #193 | Fair 64.0% |
| Paiute | 22.2 /100 | #194 | Fair 64.0% |
| Immigrants | North America | 20.0 /100 | #195 | Poor 64.0% |
| Immigrants | Canada | 19.2 /100 | #196 | Poor 64.0% |
| Seminole | 18.9 /100 | #197 | Poor 64.0% |
| Poles | 18.9 /100 | #198 | Poor 64.0% |
Demographics Similar to Immigrants from Ecuador by Family Households
In terms of family households, the demographic groups most similar to Immigrants from Ecuador are Italian (64.8%, a difference of 0.020%), Immigrants from Panama (64.8%, a difference of 0.030%), Panamanian (64.8%, a difference of 0.050%), Immigrants from Italy (64.8%, a difference of 0.050%), and Nonimmigrants (64.8%, a difference of 0.050%).
| Demographics | Rating | Rank | Family Households |
| Hmong | 93.4 /100 | #122 | Exceptional 64.9% |
| Choctaw | 93.4 /100 | #123 | Exceptional 64.9% |
| Immigrants | Argentina | 92.8 /100 | #124 | Exceptional 64.9% |
| Immigrants | Belize | 92.7 /100 | #125 | Exceptional 64.9% |
| Panamanians | 92.4 /100 | #126 | Exceptional 64.8% |
| Immigrants | Panama | 92.0 /100 | #127 | Exceptional 64.8% |
| Italians | 91.9 /100 | #128 | Exceptional 64.8% |
| Immigrants | Ecuador | 91.4 /100 | #129 | Exceptional 64.8% |
| Immigrants | Italy | 90.2 /100 | #130 | Exceptional 64.8% |
| Immigrants | Nonimmigrants | 90.1 /100 | #131 | Exceptional 64.8% |
| Cajuns | 89.4 /100 | #132 | Excellent 64.8% |
| Belizeans | 89.3 /100 | #133 | Excellent 64.8% |
| Greeks | 88.1 /100 | #134 | Excellent 64.7% |
| Maltese | 87.4 /100 | #135 | Excellent 64.7% |
| Immigrants | China | 86.6 /100 | #136 | Excellent 64.7% |