Arab vs Immigrants from Lithuania Male Unemployment
COMPARE
Arab
Immigrants from Lithuania
Male Unemployment
Male Unemployment Comparison
Arabs
Immigrants from Lithuania
5.4%
MALE UNEMPLOYMENT
30.2/ 100
METRIC RATING
188th/ 347
METRIC RANK
5.1%
MALE UNEMPLOYMENT
87.2/ 100
METRIC RATING
125th/ 347
METRIC RANK
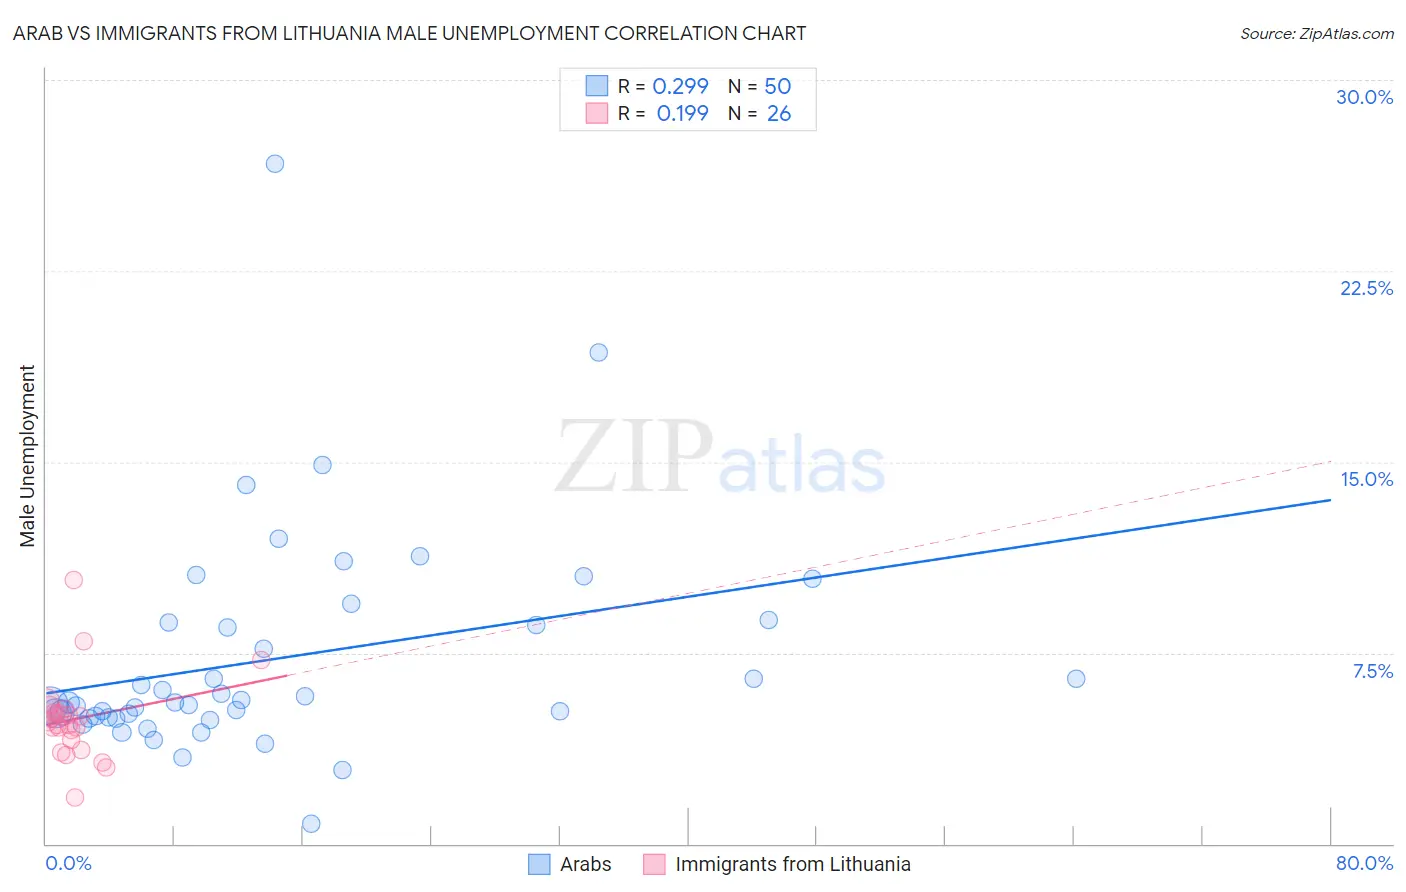
Arab vs Immigrants from Lithuania Male Unemployment Correlation Chart
The statistical analysis conducted on geographies consisting of 483,718,645 people shows a weak positive correlation between the proportion of Arabs and unemployment rate among males in the United States with a correlation coefficient (R) of 0.299 and weighted average of 5.4%. Similarly, the statistical analysis conducted on geographies consisting of 117,611,759 people shows a poor positive correlation between the proportion of Immigrants from Lithuania and unemployment rate among males in the United States with a correlation coefficient (R) of 0.199 and weighted average of 5.1%, a difference of 4.1%.
Male Unemployment Correlation Summary
| Measurement | Arab | Immigrants from Lithuania |
| Minimum | 0.80% | 1.8% |
| Maximum | 26.7% | 10.4% |
| Range | 25.9% | 8.5% |
| Mean | 7.3% | 4.9% |
| Median | 5.5% | 4.7% |
| Interquartile 25% (IQ1) | 4.9% | 4.1% |
| Interquartile 75% (IQ3) | 8.7% | 5.1% |
| Interquartile Range (IQR) | 3.7% | 1.1% |
| Standard Deviation (Sample) | 4.4% | 1.6% |
| Standard Deviation (Population) | 4.3% | 1.6% |
Similar Demographics by Male Unemployment
Demographics Similar to Arabs by Male Unemployment
In terms of male unemployment, the demographic groups most similar to Arabs are Immigrants from South America (5.4%, a difference of 0.060%), Costa Rican (5.4%, a difference of 0.080%), Iraqi (5.4%, a difference of 0.090%), Immigrants from Uganda (5.4%, a difference of 0.10%), and Immigrants from South Eastern Asia (5.4%, a difference of 0.14%).
| Demographics | Rating | Rank | Male Unemployment |
| Immigrants | Afghanistan | 37.9 /100 | #181 | Fair 5.3% |
| Potawatomi | 37.8 /100 | #182 | Fair 5.3% |
| Taiwanese | 37.6 /100 | #183 | Fair 5.3% |
| Spaniards | 35.1 /100 | #184 | Fair 5.3% |
| Koreans | 34.9 /100 | #185 | Fair 5.3% |
| Iraqis | 31.6 /100 | #186 | Fair 5.4% |
| Costa Ricans | 31.3 /100 | #187 | Fair 5.4% |
| Arabs | 30.2 /100 | #188 | Fair 5.4% |
| Immigrants | South America | 29.4 /100 | #189 | Fair 5.4% |
| Immigrants | Uganda | 28.8 /100 | #190 | Fair 5.4% |
| Immigrants | South Eastern Asia | 28.2 /100 | #191 | Fair 5.4% |
| Immigrants | Belarus | 26.0 /100 | #192 | Fair 5.4% |
| Immigrants | Israel | 25.2 /100 | #193 | Fair 5.4% |
| Spanish | 19.7 /100 | #194 | Poor 5.4% |
| Immigrants | Southern Europe | 17.7 /100 | #195 | Poor 5.4% |
Demographics Similar to Immigrants from Lithuania by Male Unemployment
In terms of male unemployment, the demographic groups most similar to Immigrants from Lithuania are Immigrants from Latvia (5.1%, a difference of 0.040%), Immigrants from Colombia (5.1%, a difference of 0.060%), Palestinian (5.1%, a difference of 0.070%), Immigrants from Brazil (5.2%, a difference of 0.11%), and Nicaraguan (5.1%, a difference of 0.14%).
| Demographics | Rating | Rank | Male Unemployment |
| Cypriots | 88.8 /100 | #118 | Excellent 5.1% |
| French Canadians | 88.6 /100 | #119 | Excellent 5.1% |
| Ukrainians | 88.4 /100 | #120 | Excellent 5.1% |
| Mongolians | 88.4 /100 | #121 | Excellent 5.1% |
| Nicaraguans | 88.2 /100 | #122 | Excellent 5.1% |
| Palestinians | 87.7 /100 | #123 | Excellent 5.1% |
| Immigrants | Latvia | 87.5 /100 | #124 | Excellent 5.1% |
| Immigrants | Lithuania | 87.2 /100 | #125 | Excellent 5.1% |
| Immigrants | Colombia | 86.8 /100 | #126 | Excellent 5.1% |
| Immigrants | Brazil | 86.3 /100 | #127 | Excellent 5.2% |
| Hungarians | 85.1 /100 | #128 | Excellent 5.2% |
| Immigrants | Western Europe | 84.8 /100 | #129 | Excellent 5.2% |
| Immigrants | Malaysia | 83.5 /100 | #130 | Excellent 5.2% |
| Immigrants | Germany | 83.0 /100 | #131 | Excellent 5.2% |
| Chickasaw | 82.9 /100 | #132 | Excellent 5.2% |