Arab vs Immigrants from Netherlands Family Households
COMPARE
Arab
Immigrants from Netherlands
Family Households
Family Households Comparison
Arabs
Immigrants from Netherlands
64.1%
FAMILY HOUSEHOLDS
24.5/ 100
METRIC RATING
191st/ 347
METRIC RANK
63.8%
FAMILY HOUSEHOLDS
9.4/ 100
METRIC RATING
212th/ 347
METRIC RANK
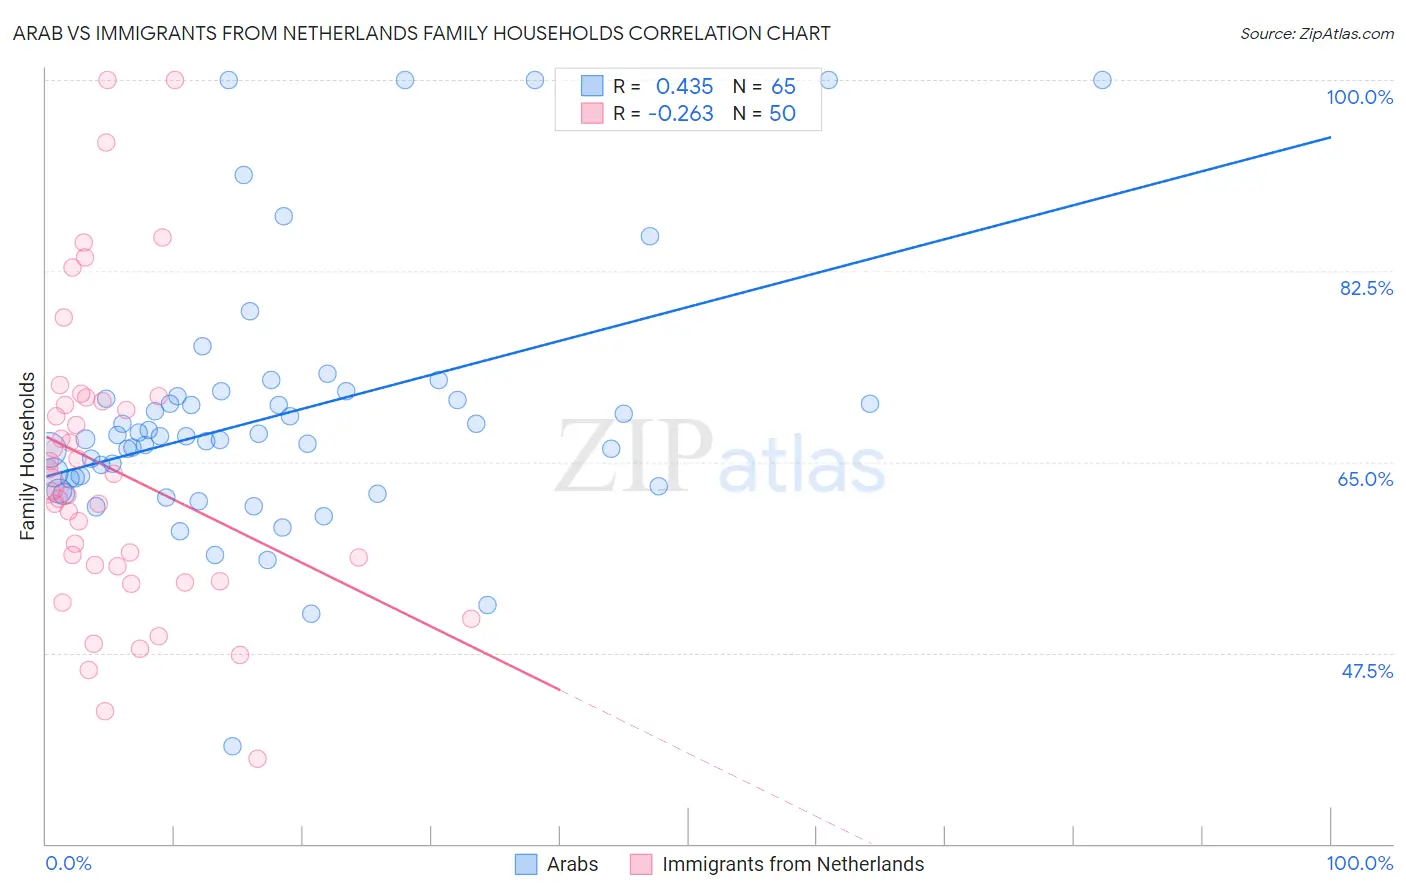
Arab vs Immigrants from Netherlands Family Households Correlation Chart
The statistical analysis conducted on geographies consisting of 486,389,490 people shows a moderate positive correlation between the proportion of Arabs and percentage of family households in the United States with a correlation coefficient (R) of 0.435 and weighted average of 64.1%. Similarly, the statistical analysis conducted on geographies consisting of 237,802,006 people shows a weak negative correlation between the proportion of Immigrants from Netherlands and percentage of family households in the United States with a correlation coefficient (R) of -0.263 and weighted average of 63.8%, a difference of 0.38%.
Family Households Correlation Summary
| Measurement | Arab | Immigrants from Netherlands |
| Minimum | 38.9% | 37.8% |
| Maximum | 100.0% | 100.0% |
| Range | 61.1% | 62.2% |
| Mean | 69.2% | 64.3% |
| Median | 67.3% | 62.6% |
| Interquartile 25% (IQ1) | 63.1% | 55.5% |
| Interquartile 75% (IQ3) | 70.9% | 70.6% |
| Interquartile Range (IQR) | 7.8% | 15.1% |
| Standard Deviation (Sample) | 11.8% | 13.8% |
| Standard Deviation (Population) | 11.7% | 13.6% |
Similar Demographics by Family Households
Demographics Similar to Arabs by Family Households
In terms of family households, the demographic groups most similar to Arabs are Zimbabwean (64.1%, a difference of 0.0%), Lithuanian (64.0%, a difference of 0.010%), French (64.0%, a difference of 0.010%), Immigrants from Western Asia (64.1%, a difference of 0.020%), and Paraguayan (64.1%, a difference of 0.040%).
| Demographics | Rating | Rank | Family Households |
| Puerto Ricans | 33.4 /100 | #184 | Fair 64.2% |
| Immigrants | Iran | 30.4 /100 | #185 | Fair 64.1% |
| Spanish Americans | 30.1 /100 | #186 | Fair 64.1% |
| Northern Europeans | 28.2 /100 | #187 | Fair 64.1% |
| Paraguayans | 26.7 /100 | #188 | Fair 64.1% |
| Immigrants | Western Asia | 25.3 /100 | #189 | Fair 64.1% |
| Zimbabweans | 24.7 /100 | #190 | Fair 64.1% |
| Arabs | 24.5 /100 | #191 | Fair 64.1% |
| Lithuanians | 23.8 /100 | #192 | Fair 64.0% |
| French | 23.7 /100 | #193 | Fair 64.0% |
| Paiute | 22.2 /100 | #194 | Fair 64.0% |
| Immigrants | North America | 20.0 /100 | #195 | Poor 64.0% |
| Immigrants | Canada | 19.2 /100 | #196 | Poor 64.0% |
| Seminole | 18.9 /100 | #197 | Poor 64.0% |
| Poles | 18.9 /100 | #198 | Poor 64.0% |
Demographics Similar to Immigrants from Netherlands by Family Households
In terms of family households, the demographic groups most similar to Immigrants from Netherlands are Shoshone (63.8%, a difference of 0.0%), Immigrants from Thailand (63.8%, a difference of 0.010%), Immigrants from Northern Europe (63.8%, a difference of 0.020%), Celtic (63.8%, a difference of 0.060%), and Nigerian (63.9%, a difference of 0.070%).
| Demographics | Rating | Rank | Family Households |
| Brazilians | 12.4 /100 | #205 | Poor 63.9% |
| Immigrants | Lithuania | 12.1 /100 | #206 | Poor 63.9% |
| Nigerians | 11.5 /100 | #207 | Poor 63.9% |
| Immigrants | Bangladesh | 11.4 /100 | #208 | Poor 63.9% |
| Sierra Leoneans | 11.2 /100 | #209 | Poor 63.9% |
| Immigrants | Thailand | 9.6 /100 | #210 | Tragic 63.8% |
| Shoshone | 9.4 /100 | #211 | Tragic 63.8% |
| Immigrants | Netherlands | 9.4 /100 | #212 | Tragic 63.8% |
| Immigrants | Northern Europe | 8.8 /100 | #213 | Tragic 63.8% |
| Celtics | 8.0 /100 | #214 | Tragic 63.8% |
| Belgians | 7.6 /100 | #215 | Tragic 63.8% |
| Croatians | 7.3 /100 | #216 | Tragic 63.8% |
| Osage | 7.0 /100 | #217 | Tragic 63.7% |
| Marshallese | 6.9 /100 | #218 | Tragic 63.7% |
| Macedonians | 6.5 /100 | #219 | Tragic 63.7% |