Arab vs Ottawa Single Mother Households
COMPARE
Arab
Ottawa
Single Mother Households
Single Mother Households Comparison
Arabs
Ottawa
6.0%
SINGLE MOTHER HOUSEHOLDS
84.0/ 100
METRIC RATING
145th/ 347
METRIC RANK
6.5%
SINGLE MOTHER HOUSEHOLDS
23.8/ 100
METRIC RATING
188th/ 347
METRIC RANK
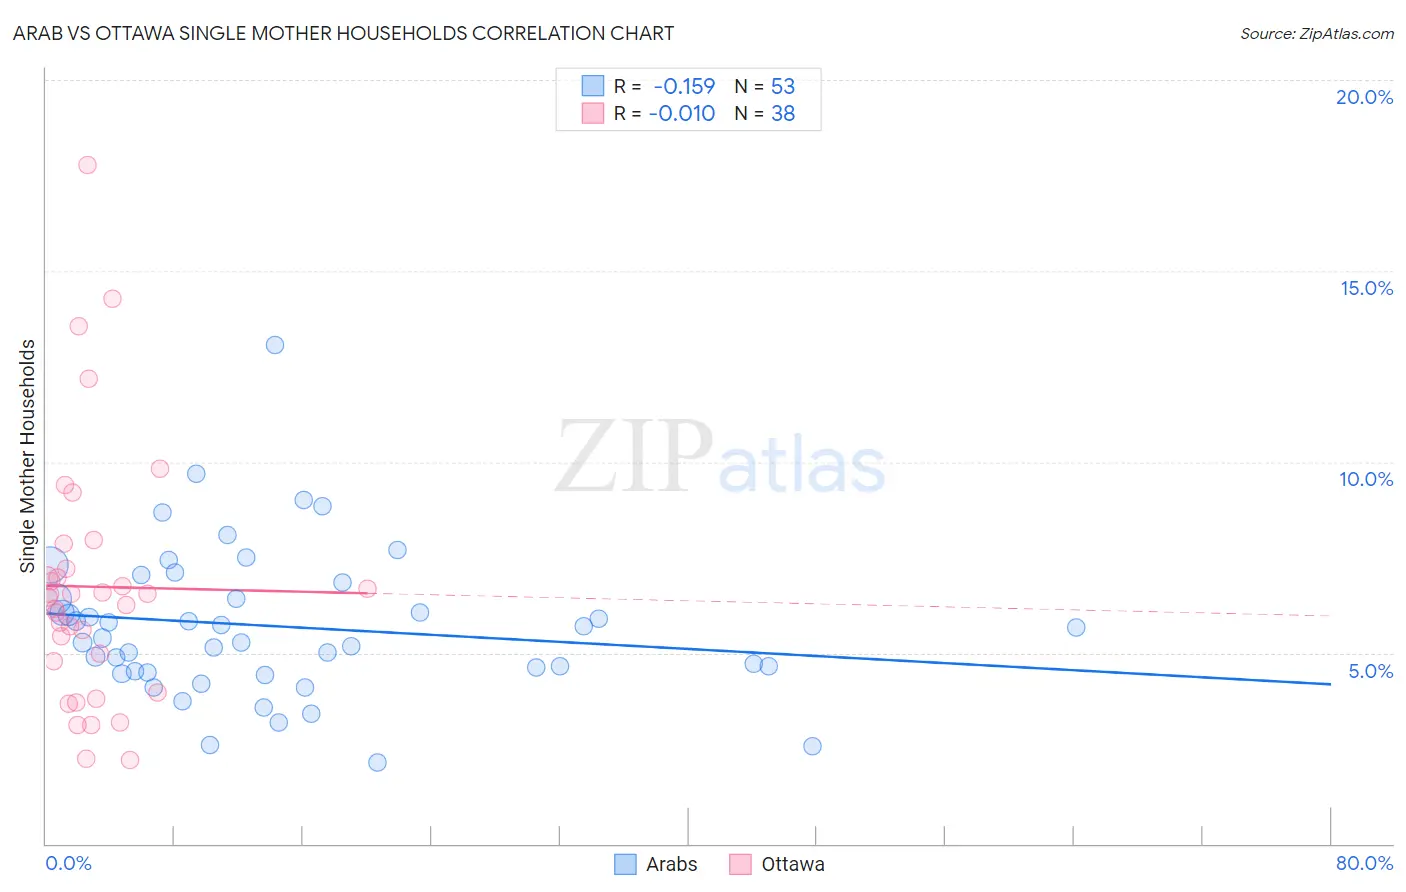
Arab vs Ottawa Single Mother Households Correlation Chart
The statistical analysis conducted on geographies consisting of 484,798,237 people shows a poor negative correlation between the proportion of Arabs and percentage of single mother households in the United States with a correlation coefficient (R) of -0.159 and weighted average of 6.0%. Similarly, the statistical analysis conducted on geographies consisting of 49,919,182 people shows no correlation between the proportion of Ottawa and percentage of single mother households in the United States with a correlation coefficient (R) of -0.010 and weighted average of 6.5%, a difference of 8.1%.
Single Mother Households Correlation Summary
| Measurement | Arab | Ottawa |
| Minimum | 2.1% | 2.2% |
| Maximum | 13.1% | 17.8% |
| Range | 10.9% | 15.6% |
| Mean | 5.7% | 6.7% |
| Median | 5.4% | 6.5% |
| Interquartile 25% (IQ1) | 4.5% | 4.8% |
| Interquartile 75% (IQ3) | 6.6% | 7.2% |
| Interquartile Range (IQR) | 2.1% | 2.4% |
| Standard Deviation (Sample) | 2.0% | 3.3% |
| Standard Deviation (Population) | 1.9% | 3.3% |
Similar Demographics by Single Mother Households
Demographics Similar to Arabs by Single Mother Households
In terms of single mother households, the demographic groups most similar to Arabs are Korean (6.0%, a difference of 0.090%), Immigrants from Iraq (6.0%, a difference of 0.19%), Immigrants from Egypt (6.0%, a difference of 0.23%), Tsimshian (6.0%, a difference of 0.28%), and French Canadian (6.0%, a difference of 0.29%).
| Demographics | Rating | Rank | Single Mother Households |
| Icelanders | 86.9 /100 | #138 | Excellent 6.0% |
| Syrians | 86.0 /100 | #139 | Excellent 6.0% |
| French | 85.7 /100 | #140 | Excellent 6.0% |
| Tsimshian | 85.2 /100 | #141 | Excellent 6.0% |
| Immigrants | Egypt | 85.0 /100 | #142 | Excellent 6.0% |
| Immigrants | Iraq | 84.8 /100 | #143 | Excellent 6.0% |
| Koreans | 84.4 /100 | #144 | Excellent 6.0% |
| Arabs | 84.0 /100 | #145 | Excellent 6.0% |
| French Canadians | 82.6 /100 | #146 | Excellent 6.0% |
| Immigrants | Jordan | 82.3 /100 | #147 | Excellent 6.0% |
| Scotch-Irish | 82.0 /100 | #148 | Excellent 6.0% |
| Immigrants | Albania | 81.5 /100 | #149 | Excellent 6.1% |
| Zimbabweans | 80.7 /100 | #150 | Excellent 6.1% |
| Immigrants | Southern Europe | 80.5 /100 | #151 | Excellent 6.1% |
| Pakistanis | 79.2 /100 | #152 | Good 6.1% |
Demographics Similar to Ottawa by Single Mother Households
In terms of single mother households, the demographic groups most similar to Ottawa are Delaware (6.5%, a difference of 0.070%), Immigrants from Afghanistan (6.5%, a difference of 0.13%), Costa Rican (6.5%, a difference of 0.14%), Ugandan (6.5%, a difference of 0.26%), and Ethiopian (6.5%, a difference of 0.32%).
| Demographics | Rating | Rank | Single Mother Households |
| Spanish | 33.4 /100 | #181 | Fair 6.4% |
| South American Indians | 33.4 /100 | #182 | Fair 6.4% |
| Spaniards | 27.8 /100 | #183 | Fair 6.5% |
| Ethiopians | 26.0 /100 | #184 | Fair 6.5% |
| Ugandans | 25.6 /100 | #185 | Fair 6.5% |
| Costa Ricans | 24.8 /100 | #186 | Fair 6.5% |
| Immigrants | Afghanistan | 24.7 /100 | #187 | Fair 6.5% |
| Ottawa | 23.8 /100 | #188 | Fair 6.5% |
| Delaware | 23.3 /100 | #189 | Fair 6.5% |
| Peruvians | 21.6 /100 | #190 | Fair 6.5% |
| Samoans | 21.2 /100 | #191 | Fair 6.5% |
| Americans | 19.0 /100 | #192 | Poor 6.6% |
| Colombians | 18.3 /100 | #193 | Poor 6.6% |
| Immigrants | Uganda | 18.3 /100 | #194 | Poor 6.6% |
| South Americans | 18.0 /100 | #195 | Poor 6.6% |