Arab vs Immigrants from Belize In Labor Force | Age 20-64
COMPARE
Arab
Immigrants from Belize
In Labor Force | Age 20-64
In Labor Force | Age 20-64 Comparison
Arabs
Immigrants from Belize
79.2%
IN LABOR FORCE | AGE 20-64
11.4/ 100
METRIC RATING
216th/ 347
METRIC RANK
78.0%
IN LABOR FORCE | AGE 20-64
0.0/ 100
METRIC RATING
286th/ 347
METRIC RANK
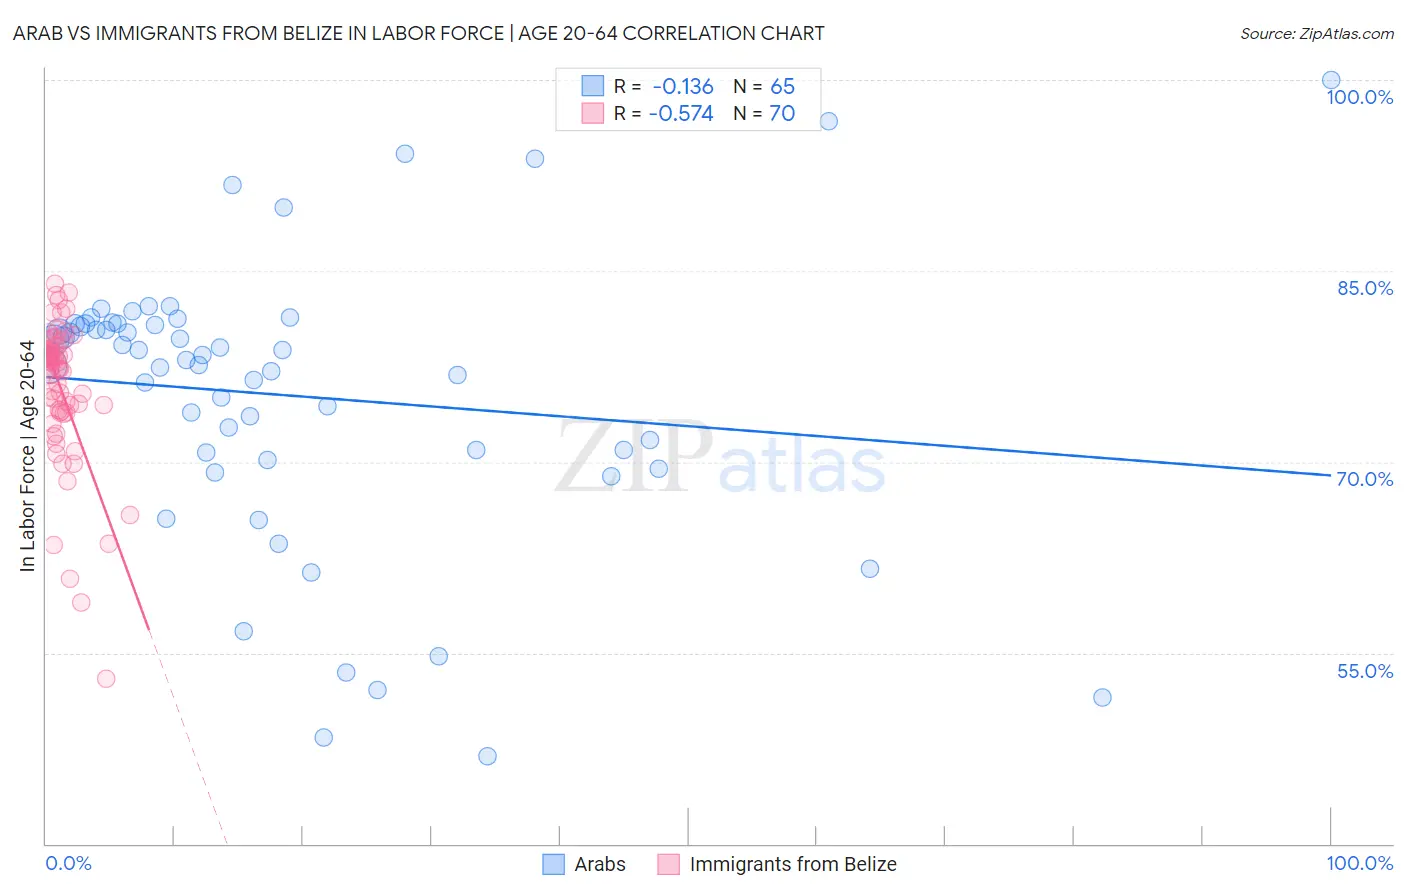
Arab vs Immigrants from Belize In Labor Force | Age 20-64 Correlation Chart
The statistical analysis conducted on geographies consisting of 486,876,166 people shows a poor negative correlation between the proportion of Arabs and labor force participation rate among population between the ages 20 and 64 in the United States with a correlation coefficient (R) of -0.136 and weighted average of 79.2%. Similarly, the statistical analysis conducted on geographies consisting of 130,318,427 people shows a substantial negative correlation between the proportion of Immigrants from Belize and labor force participation rate among population between the ages 20 and 64 in the United States with a correlation coefficient (R) of -0.574 and weighted average of 78.0%, a difference of 1.6%.
In Labor Force | Age 20-64 Correlation Summary
| Measurement | Arab | Immigrants from Belize |
| Minimum | 46.9% | 53.0% |
| Maximum | 100.0% | 84.0% |
| Range | 53.1% | 31.0% |
| Mean | 75.2% | 75.6% |
| Median | 78.0% | 77.3% |
| Interquartile 25% (IQ1) | 70.4% | 73.9% |
| Interquartile 75% (IQ3) | 80.8% | 78.8% |
| Interquartile Range (IQR) | 10.4% | 4.9% |
| Standard Deviation (Sample) | 11.1% | 5.8% |
| Standard Deviation (Population) | 11.0% | 5.7% |
Similar Demographics by In Labor Force | Age 20-64
Demographics Similar to Arabs by In Labor Force | Age 20-64
In terms of in labor force | age 20-64, the demographic groups most similar to Arabs are Immigrants from Armenia (79.2%, a difference of 0.010%), Immigrants from Norway (79.2%, a difference of 0.010%), Immigrants from Western Asia (79.2%, a difference of 0.010%), Irish (79.3%, a difference of 0.030%), and Immigrants from Portugal (79.3%, a difference of 0.030%).
| Demographics | Rating | Rank | In Labor Force | Age 20-64 |
| Bangladeshis | 16.4 /100 | #209 | Poor 79.3% |
| Haitians | 16.1 /100 | #210 | Poor 79.3% |
| Europeans | 15.3 /100 | #211 | Poor 79.3% |
| Irish | 13.2 /100 | #212 | Poor 79.3% |
| Immigrants | Portugal | 12.8 /100 | #213 | Poor 79.3% |
| Immigrants | Armenia | 12.2 /100 | #214 | Poor 79.2% |
| Immigrants | Norway | 12.0 /100 | #215 | Poor 79.2% |
| Arabs | 11.4 /100 | #216 | Poor 79.2% |
| Immigrants | Western Asia | 11.0 /100 | #217 | Poor 79.2% |
| Immigrants | England | 9.3 /100 | #218 | Tragic 79.2% |
| French Canadians | 8.4 /100 | #219 | Tragic 79.2% |
| Immigrants | Immigrants | 7.7 /100 | #220 | Tragic 79.2% |
| Hungarians | 7.2 /100 | #221 | Tragic 79.2% |
| Immigrants | Panama | 6.9 /100 | #222 | Tragic 79.1% |
| Canadians | 6.8 /100 | #223 | Tragic 79.1% |
Demographics Similar to Immigrants from Belize by In Labor Force | Age 20-64
In terms of in labor force | age 20-64, the demographic groups most similar to Immigrants from Belize are Vietnamese (78.0%, a difference of 0.0%), Osage (78.0%, a difference of 0.010%), Hmong (77.9%, a difference of 0.080%), African (77.9%, a difference of 0.090%), and Immigrants from Bangladesh (77.9%, a difference of 0.10%).
| Demographics | Rating | Rank | In Labor Force | Age 20-64 |
| Belizeans | 0.0 /100 | #279 | Tragic 78.2% |
| Immigrants | Dominica | 0.0 /100 | #280 | Tragic 78.1% |
| Guyanese | 0.0 /100 | #281 | Tragic 78.1% |
| Immigrants | St. Vincent and the Grenadines | 0.0 /100 | #282 | Tragic 78.1% |
| Immigrants | Nonimmigrants | 0.0 /100 | #283 | Tragic 78.1% |
| Immigrants | Guyana | 0.0 /100 | #284 | Tragic 78.1% |
| Osage | 0.0 /100 | #285 | Tragic 78.0% |
| Immigrants | Belize | 0.0 /100 | #286 | Tragic 78.0% |
| Vietnamese | 0.0 /100 | #287 | Tragic 78.0% |
| Hmong | 0.0 /100 | #288 | Tragic 77.9% |
| Africans | 0.0 /100 | #289 | Tragic 77.9% |
| Immigrants | Bangladesh | 0.0 /100 | #290 | Tragic 77.9% |
| Spanish Americans | 0.0 /100 | #291 | Tragic 77.8% |
| Immigrants | Azores | 0.0 /100 | #292 | Tragic 77.8% |
| Delaware | 0.0 /100 | #293 | Tragic 77.8% |