Arab vs Immigrants from Belize Male Disability
COMPARE
Arab
Immigrants from Belize
Male Disability
Male Disability Comparison
Arabs
Immigrants from Belize
11.0%
MALE DISABILITY
81.5/ 100
METRIC RATING
141st/ 347
METRIC RANK
11.3%
MALE DISABILITY
33.7/ 100
METRIC RATING
182nd/ 347
METRIC RANK
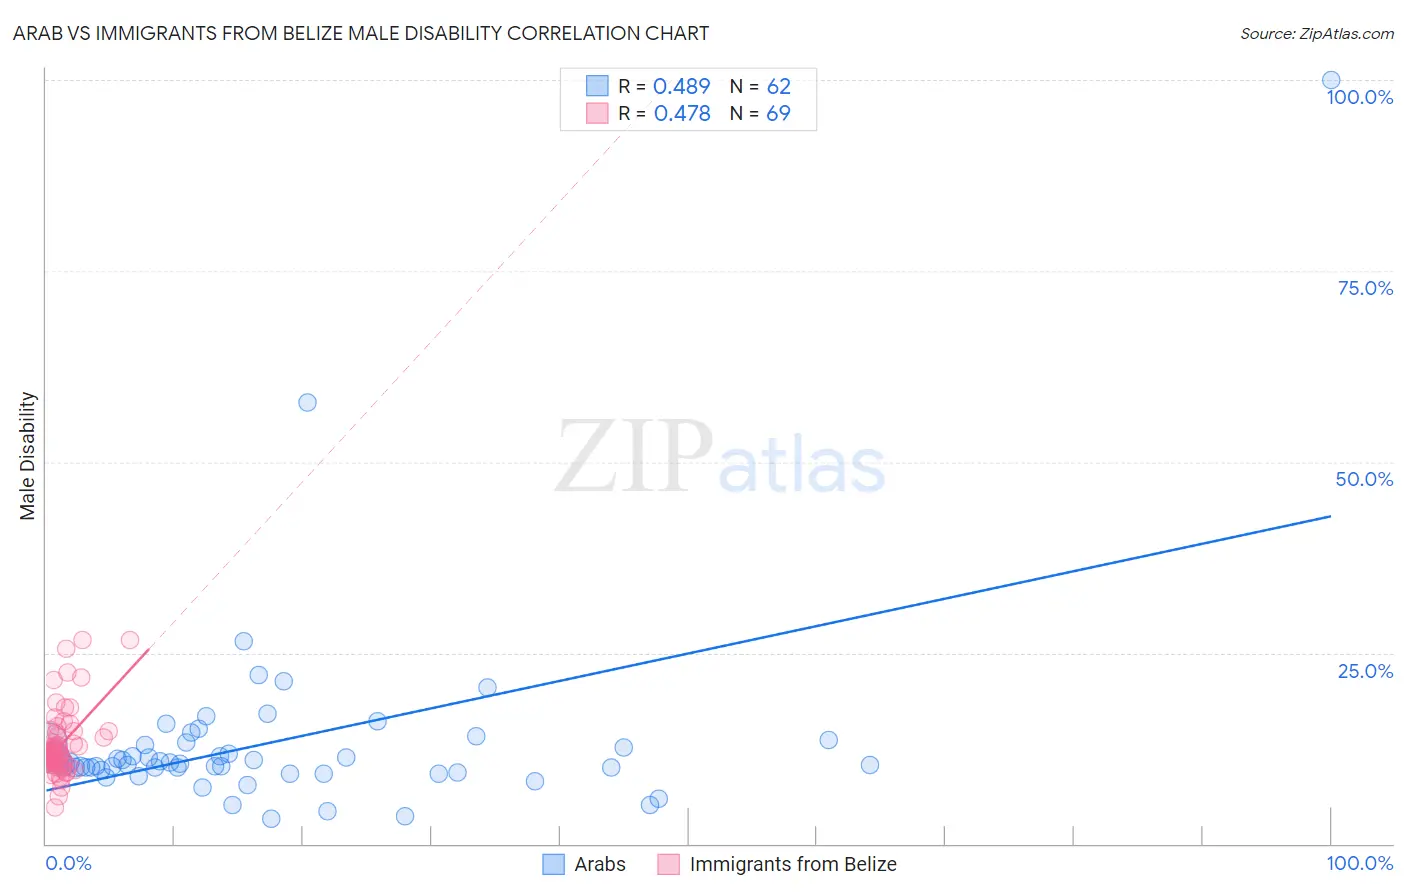
Arab vs Immigrants from Belize Male Disability Correlation Chart
The statistical analysis conducted on geographies consisting of 486,768,170 people shows a moderate positive correlation between the proportion of Arabs and percentage of males with a disability in the United States with a correlation coefficient (R) of 0.489 and weighted average of 11.0%. Similarly, the statistical analysis conducted on geographies consisting of 130,304,028 people shows a moderate positive correlation between the proportion of Immigrants from Belize and percentage of males with a disability in the United States with a correlation coefficient (R) of 0.478 and weighted average of 11.3%, a difference of 3.0%.
Male Disability Correlation Summary
| Measurement | Arab | Immigrants from Belize |
| Minimum | 3.3% | 4.7% |
| Maximum | 100.0% | 26.7% |
| Range | 96.7% | 22.0% |
| Mean | 13.5% | 12.9% |
| Median | 10.5% | 11.7% |
| Interquartile 25% (IQ1) | 9.6% | 10.6% |
| Interquartile 75% (IQ3) | 13.2% | 14.3% |
| Interquartile Range (IQR) | 3.6% | 3.7% |
| Standard Deviation (Sample) | 13.3% | 4.3% |
| Standard Deviation (Population) | 13.2% | 4.3% |
Similar Demographics by Male Disability
Demographics Similar to Arabs by Male Disability
In terms of male disability, the demographic groups most similar to Arabs are Immigrants from Italy (11.0%, a difference of 0.0%), Immigrants from Sudan (11.0%, a difference of 0.0%), South African (11.0%, a difference of 0.020%), Nigerian (11.0%, a difference of 0.040%), and Immigrants from Europe (11.0%, a difference of 0.050%).
| Demographics | Rating | Rank | Male Disability |
| Bhutanese | 83.4 /100 | #134 | Excellent 11.0% |
| Trinidadians and Tobagonians | 83.3 /100 | #135 | Excellent 11.0% |
| Immigrants | Costa Rica | 82.8 /100 | #136 | Excellent 11.0% |
| Immigrants | Europe | 82.0 /100 | #137 | Excellent 11.0% |
| Nigerians | 81.9 /100 | #138 | Excellent 11.0% |
| South Africans | 81.7 /100 | #139 | Excellent 11.0% |
| Immigrants | Italy | 81.5 /100 | #140 | Excellent 11.0% |
| Arabs | 81.5 /100 | #141 | Excellent 11.0% |
| Immigrants | Sudan | 81.5 /100 | #142 | Excellent 11.0% |
| Moroccans | 80.7 /100 | #143 | Excellent 11.0% |
| Kenyans | 78.1 /100 | #144 | Good 11.0% |
| Costa Ricans | 78.0 /100 | #145 | Good 11.0% |
| Koreans | 77.5 /100 | #146 | Good 11.0% |
| Immigrants | Croatia | 77.3 /100 | #147 | Good 11.0% |
| Sudanese | 77.1 /100 | #148 | Good 11.0% |
Demographics Similar to Immigrants from Belize by Male Disability
In terms of male disability, the demographic groups most similar to Immigrants from Belize are Immigrants from Senegal (11.3%, a difference of 0.040%), Immigrants from Central America (11.3%, a difference of 0.050%), Iraqi (11.3%, a difference of 0.20%), Pakistani (11.3%, a difference of 0.21%), and Immigrants from Zaire (11.4%, a difference of 0.39%).
| Demographics | Rating | Rank | Male Disability |
| Immigrants | Honduras | 48.7 /100 | #175 | Average 11.2% |
| Syrians | 46.6 /100 | #176 | Average 11.2% |
| Immigrants | Norway | 44.2 /100 | #177 | Average 11.3% |
| Australians | 42.2 /100 | #178 | Average 11.3% |
| Immigrants | Caribbean | 41.4 /100 | #179 | Average 11.3% |
| Hondurans | 41.1 /100 | #180 | Average 11.3% |
| Immigrants | Senegal | 34.4 /100 | #181 | Fair 11.3% |
| Immigrants | Belize | 33.7 /100 | #182 | Fair 11.3% |
| Immigrants | Central America | 32.9 /100 | #183 | Fair 11.3% |
| Iraqis | 30.5 /100 | #184 | Fair 11.3% |
| Pakistanis | 30.3 /100 | #185 | Fair 11.3% |
| Immigrants | Zaire | 27.6 /100 | #186 | Fair 11.4% |
| Immigrants | Austria | 27.3 /100 | #187 | Fair 11.4% |
| Estonians | 26.8 /100 | #188 | Fair 11.4% |
| Immigrants | Netherlands | 25.9 /100 | #189 | Fair 11.4% |