Arab vs Lumbee Single Mother Households
COMPARE
Arab
Lumbee
Single Mother Households
Single Mother Households Comparison
Arabs
Lumbee
6.0%
SINGLE MOTHER HOUSEHOLDS
84.0/ 100
METRIC RATING
145th/ 347
METRIC RANK
9.1%
SINGLE MOTHER HOUSEHOLDS
0.0/ 100
METRIC RATING
340th/ 347
METRIC RANK
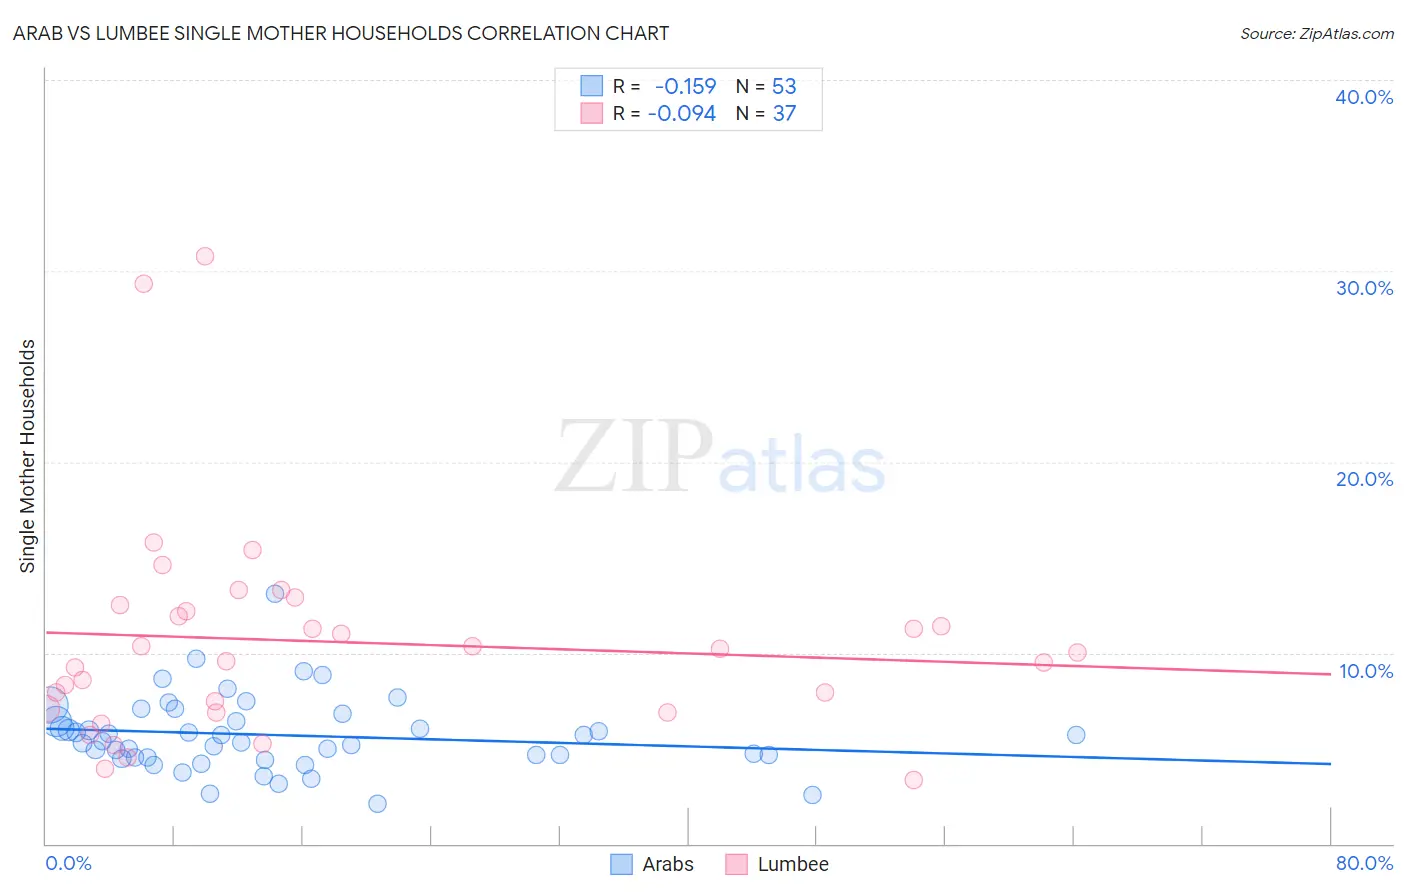
Arab vs Lumbee Single Mother Households Correlation Chart
The statistical analysis conducted on geographies consisting of 484,798,237 people shows a poor negative correlation between the proportion of Arabs and percentage of single mother households in the United States with a correlation coefficient (R) of -0.159 and weighted average of 6.0%. Similarly, the statistical analysis conducted on geographies consisting of 92,236,041 people shows a slight negative correlation between the proportion of Lumbee and percentage of single mother households in the United States with a correlation coefficient (R) of -0.094 and weighted average of 9.1%, a difference of 51.0%.
Single Mother Households Correlation Summary
| Measurement | Arab | Lumbee |
| Minimum | 2.1% | 3.3% |
| Maximum | 13.1% | 30.7% |
| Range | 10.9% | 27.4% |
| Mean | 5.7% | 10.6% |
| Median | 5.4% | 10.0% |
| Interquartile 25% (IQ1) | 4.5% | 7.0% |
| Interquartile 75% (IQ3) | 6.6% | 12.3% |
| Interquartile Range (IQR) | 2.1% | 5.3% |
| Standard Deviation (Sample) | 2.0% | 5.7% |
| Standard Deviation (Population) | 1.9% | 5.6% |
Similar Demographics by Single Mother Households
Demographics Similar to Arabs by Single Mother Households
In terms of single mother households, the demographic groups most similar to Arabs are Korean (6.0%, a difference of 0.090%), Immigrants from Iraq (6.0%, a difference of 0.19%), Immigrants from Egypt (6.0%, a difference of 0.23%), Tsimshian (6.0%, a difference of 0.28%), and French Canadian (6.0%, a difference of 0.29%).
| Demographics | Rating | Rank | Single Mother Households |
| Icelanders | 86.9 /100 | #138 | Excellent 6.0% |
| Syrians | 86.0 /100 | #139 | Excellent 6.0% |
| French | 85.7 /100 | #140 | Excellent 6.0% |
| Tsimshian | 85.2 /100 | #141 | Excellent 6.0% |
| Immigrants | Egypt | 85.0 /100 | #142 | Excellent 6.0% |
| Immigrants | Iraq | 84.8 /100 | #143 | Excellent 6.0% |
| Koreans | 84.4 /100 | #144 | Excellent 6.0% |
| Arabs | 84.0 /100 | #145 | Excellent 6.0% |
| French Canadians | 82.6 /100 | #146 | Excellent 6.0% |
| Immigrants | Jordan | 82.3 /100 | #147 | Excellent 6.0% |
| Scotch-Irish | 82.0 /100 | #148 | Excellent 6.0% |
| Immigrants | Albania | 81.5 /100 | #149 | Excellent 6.1% |
| Zimbabweans | 80.7 /100 | #150 | Excellent 6.1% |
| Immigrants | Southern Europe | 80.5 /100 | #151 | Excellent 6.1% |
| Pakistanis | 79.2 /100 | #152 | Good 6.1% |
Demographics Similar to Lumbee by Single Mother Households
In terms of single mother households, the demographic groups most similar to Lumbee are Tohono O'odham (9.1%, a difference of 0.36%), Menominee (9.2%, a difference of 0.68%), Dominican (9.2%, a difference of 0.89%), Black/African American (9.0%, a difference of 1.2%), and Cape Verdean (8.9%, a difference of 2.8%).
| Demographics | Rating | Rank | Single Mother Households |
| Liberians | 0.0 /100 | #333 | Tragic 8.6% |
| Immigrants | Liberia | 0.0 /100 | #334 | Tragic 8.7% |
| Immigrants | Dominica | 0.0 /100 | #335 | Tragic 8.7% |
| Puerto Ricans | 0.0 /100 | #336 | Tragic 8.7% |
| Navajo | 0.0 /100 | #337 | Tragic 8.8% |
| Cape Verdeans | 0.0 /100 | #338 | Tragic 8.9% |
| Blacks/African Americans | 0.0 /100 | #339 | Tragic 9.0% |
| Lumbee | 0.0 /100 | #340 | Tragic 9.1% |
| Tohono O'odham | 0.0 /100 | #341 | Tragic 9.1% |
| Menominee | 0.0 /100 | #342 | Tragic 9.2% |
| Dominicans | 0.0 /100 | #343 | Tragic 9.2% |
| Immigrants | Dominican Republic | 0.0 /100 | #344 | Tragic 9.5% |
| Immigrants | Cabo Verde | 0.0 /100 | #345 | Tragic 9.6% |
| Yuman | 0.0 /100 | #346 | Tragic 9.6% |
| Yup'ik | 0.0 /100 | #347 | Tragic 10.0% |