Arab vs Immigrants from Philippines Single Mother Households
COMPARE
Arab
Immigrants from Philippines
Single Mother Households
Single Mother Households Comparison
Arabs
Immigrants from Philippines
6.0%
SINGLE MOTHER HOUSEHOLDS
84.0/ 100
METRIC RATING
145th/ 347
METRIC RANK
6.1%
SINGLE MOTHER HOUSEHOLDS
78.5/ 100
METRIC RATING
154th/ 347
METRIC RANK
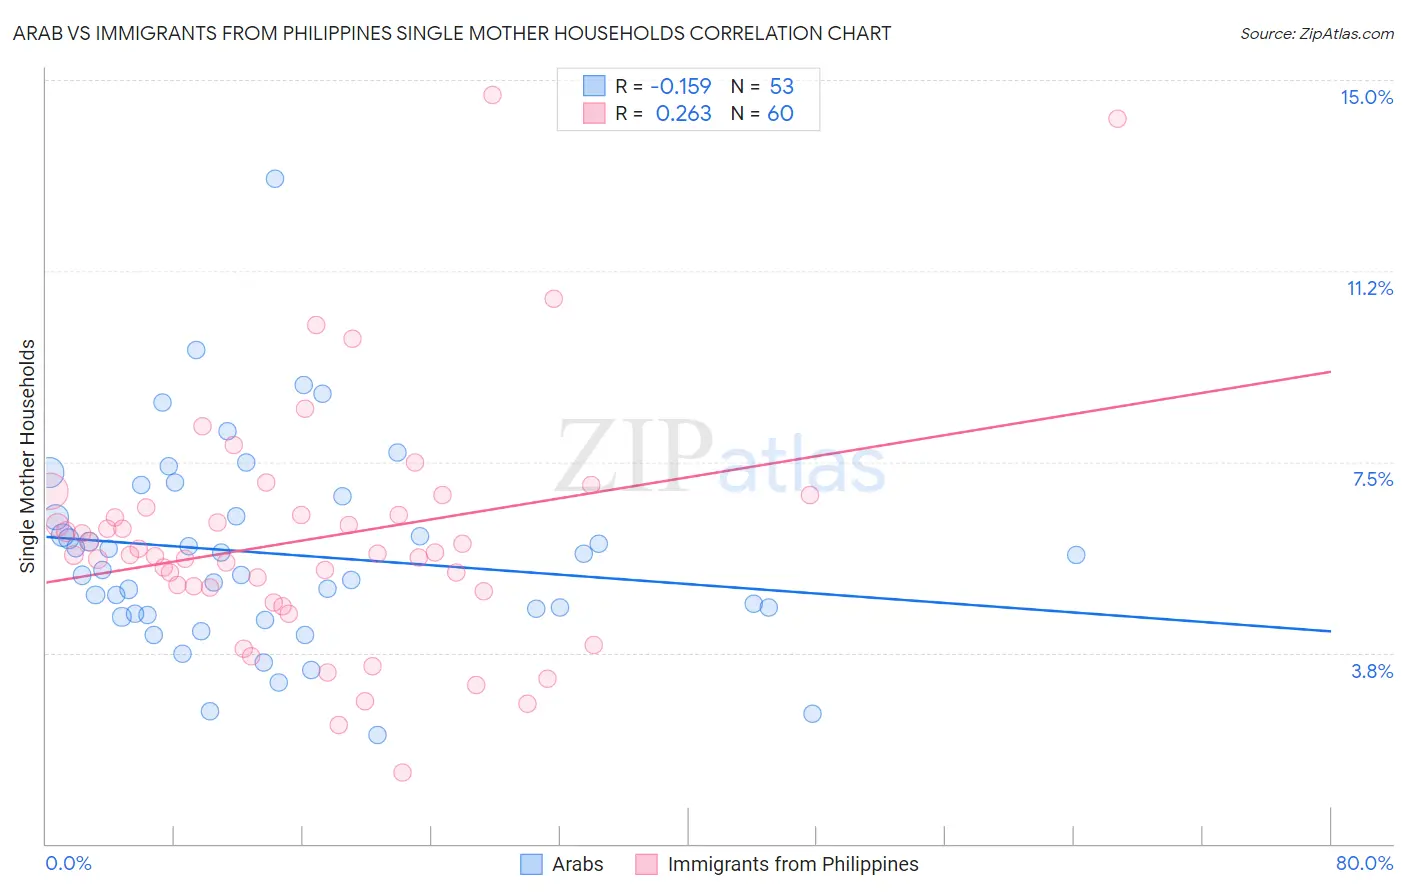
Arab vs Immigrants from Philippines Single Mother Households Correlation Chart
The statistical analysis conducted on geographies consisting of 484,798,237 people shows a poor negative correlation between the proportion of Arabs and percentage of single mother households in the United States with a correlation coefficient (R) of -0.159 and weighted average of 6.0%. Similarly, the statistical analysis conducted on geographies consisting of 469,636,643 people shows a weak positive correlation between the proportion of Immigrants from Philippines and percentage of single mother households in the United States with a correlation coefficient (R) of 0.263 and weighted average of 6.1%, a difference of 1.0%.
Single Mother Households Correlation Summary
| Measurement | Arab | Immigrants from Philippines |
| Minimum | 2.1% | 1.4% |
| Maximum | 13.1% | 14.7% |
| Range | 10.9% | 13.3% |
| Mean | 5.7% | 6.0% |
| Median | 5.4% | 5.7% |
| Interquartile 25% (IQ1) | 4.5% | 5.0% |
| Interquartile 75% (IQ3) | 6.6% | 6.5% |
| Interquartile Range (IQR) | 2.1% | 1.5% |
| Standard Deviation (Sample) | 2.0% | 2.4% |
| Standard Deviation (Population) | 1.9% | 2.4% |
Demographics Similar to Arabs and Immigrants from Philippines by Single Mother Households
In terms of single mother households, the demographic groups most similar to Arabs are Korean (6.0%, a difference of 0.090%), Immigrants from Iraq (6.0%, a difference of 0.19%), Immigrants from Egypt (6.0%, a difference of 0.23%), Tsimshian (6.0%, a difference of 0.28%), and French Canadian (6.0%, a difference of 0.29%). Similarly, the demographic groups most similar to Immigrants from Philippines are Immigrants from Brazil (6.1%, a difference of 0.070%), Pakistani (6.1%, a difference of 0.11%), White/Caucasian (6.1%, a difference of 0.33%), Immigrants from Southern Europe (6.1%, a difference of 0.34%), and Zimbabwean (6.1%, a difference of 0.39%).
| Demographics | Rating | Rank | Single Mother Households |
| Syrians | 86.0 /100 | #139 | Excellent 6.0% |
| French | 85.7 /100 | #140 | Excellent 6.0% |
| Tsimshian | 85.2 /100 | #141 | Excellent 6.0% |
| Immigrants | Egypt | 85.0 /100 | #142 | Excellent 6.0% |
| Immigrants | Iraq | 84.8 /100 | #143 | Excellent 6.0% |
| Koreans | 84.4 /100 | #144 | Excellent 6.0% |
| Arabs | 84.0 /100 | #145 | Excellent 6.0% |
| French Canadians | 82.6 /100 | #146 | Excellent 6.0% |
| Immigrants | Jordan | 82.3 /100 | #147 | Excellent 6.0% |
| Scotch-Irish | 82.0 /100 | #148 | Excellent 6.0% |
| Immigrants | Albania | 81.5 /100 | #149 | Excellent 6.1% |
| Zimbabweans | 80.7 /100 | #150 | Excellent 6.1% |
| Immigrants | Southern Europe | 80.5 /100 | #151 | Excellent 6.1% |
| Pakistanis | 79.2 /100 | #152 | Good 6.1% |
| Immigrants | Brazil | 78.9 /100 | #153 | Good 6.1% |
| Immigrants | Philippines | 78.5 /100 | #154 | Good 6.1% |
| Whites/Caucasians | 76.5 /100 | #155 | Good 6.1% |
| Native Hawaiians | 75.0 /100 | #156 | Good 6.1% |
| Chileans | 74.2 /100 | #157 | Good 6.1% |
| Celtics | 73.3 /100 | #158 | Good 6.1% |
| Yugoslavians | 73.1 /100 | #159 | Good 6.1% |