Arab vs Cypriot Single Mother Households
COMPARE
Arab
Cypriot
Single Mother Households
Single Mother Households Comparison
Arabs
Cypriots
6.0%
SINGLE MOTHER HOUSEHOLDS
84.0/ 100
METRIC RATING
145th/ 347
METRIC RANK
5.1%
SINGLE MOTHER HOUSEHOLDS
99.9/ 100
METRIC RATING
12th/ 347
METRIC RANK
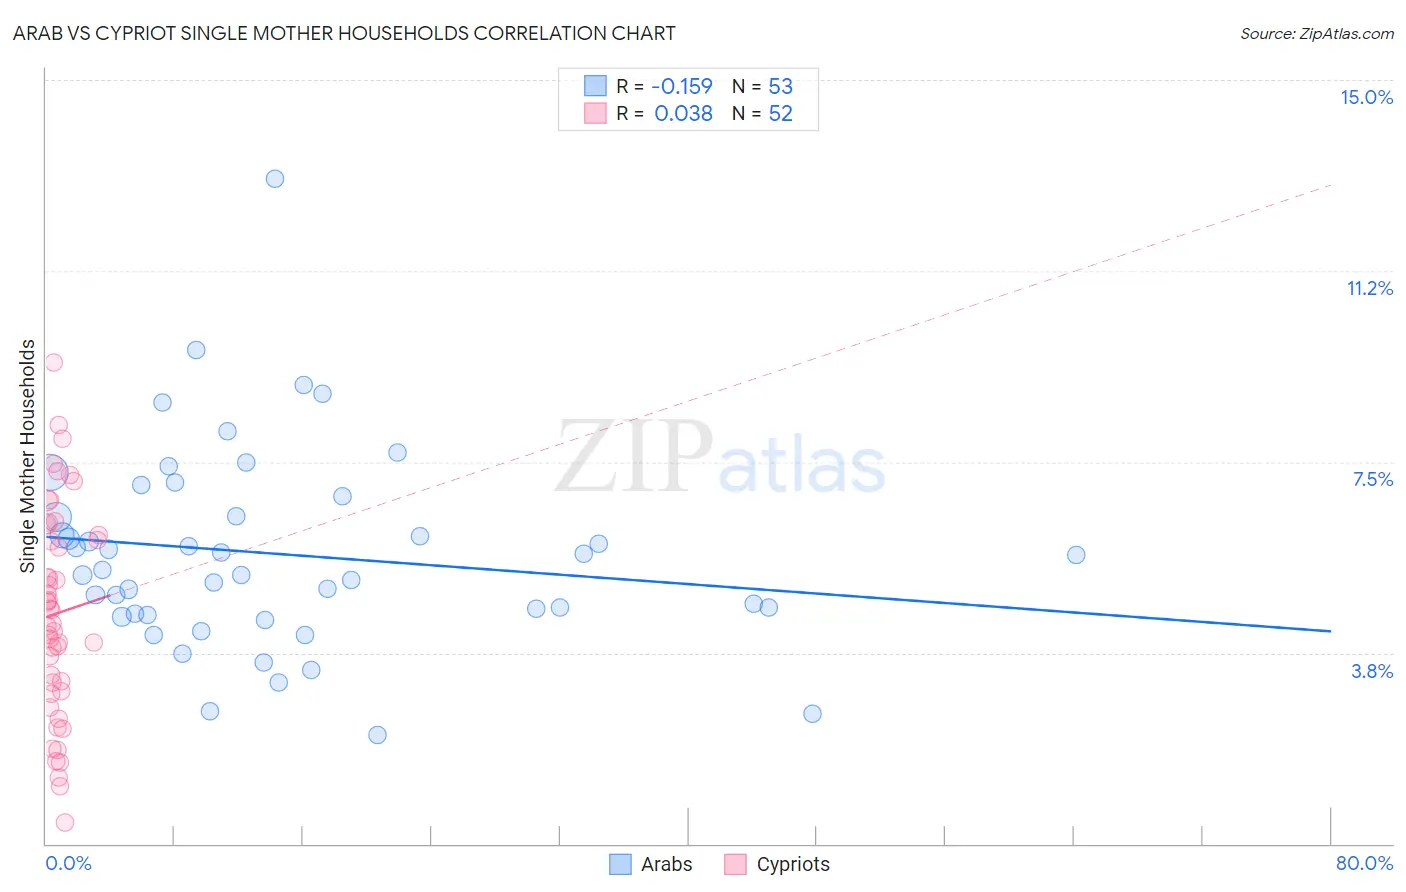
Arab vs Cypriot Single Mother Households Correlation Chart
The statistical analysis conducted on geographies consisting of 484,798,237 people shows a poor negative correlation between the proportion of Arabs and percentage of single mother households in the United States with a correlation coefficient (R) of -0.159 and weighted average of 6.0%. Similarly, the statistical analysis conducted on geographies consisting of 61,798,444 people shows no correlation between the proportion of Cypriots and percentage of single mother households in the United States with a correlation coefficient (R) of 0.038 and weighted average of 5.1%, a difference of 18.9%.
Single Mother Households Correlation Summary
| Measurement | Arab | Cypriot |
| Minimum | 2.1% | 0.41% |
| Maximum | 13.1% | 9.5% |
| Range | 10.9% | 9.0% |
| Mean | 5.7% | 4.5% |
| Median | 5.4% | 4.5% |
| Interquartile 25% (IQ1) | 4.5% | 3.1% |
| Interquartile 75% (IQ3) | 6.6% | 6.0% |
| Interquartile Range (IQR) | 2.1% | 2.9% |
| Standard Deviation (Sample) | 2.0% | 2.0% |
| Standard Deviation (Population) | 1.9% | 2.0% |
Similar Demographics by Single Mother Households
Demographics Similar to Arabs by Single Mother Households
In terms of single mother households, the demographic groups most similar to Arabs are Korean (6.0%, a difference of 0.090%), Immigrants from Iraq (6.0%, a difference of 0.19%), Immigrants from Egypt (6.0%, a difference of 0.23%), Tsimshian (6.0%, a difference of 0.28%), and French Canadian (6.0%, a difference of 0.29%).
| Demographics | Rating | Rank | Single Mother Households |
| Icelanders | 86.9 /100 | #138 | Excellent 6.0% |
| Syrians | 86.0 /100 | #139 | Excellent 6.0% |
| French | 85.7 /100 | #140 | Excellent 6.0% |
| Tsimshian | 85.2 /100 | #141 | Excellent 6.0% |
| Immigrants | Egypt | 85.0 /100 | #142 | Excellent 6.0% |
| Immigrants | Iraq | 84.8 /100 | #143 | Excellent 6.0% |
| Koreans | 84.4 /100 | #144 | Excellent 6.0% |
| Arabs | 84.0 /100 | #145 | Excellent 6.0% |
| French Canadians | 82.6 /100 | #146 | Excellent 6.0% |
| Immigrants | Jordan | 82.3 /100 | #147 | Excellent 6.0% |
| Scotch-Irish | 82.0 /100 | #148 | Excellent 6.0% |
| Immigrants | Albania | 81.5 /100 | #149 | Excellent 6.1% |
| Zimbabweans | 80.7 /100 | #150 | Excellent 6.1% |
| Immigrants | Southern Europe | 80.5 /100 | #151 | Excellent 6.1% |
| Pakistanis | 79.2 /100 | #152 | Good 6.1% |
Demographics Similar to Cypriots by Single Mother Households
In terms of single mother households, the demographic groups most similar to Cypriots are Immigrants from India (5.1%, a difference of 0.12%), Immigrants from China (5.1%, a difference of 0.18%), Immigrants from Australia (5.1%, a difference of 0.45%), Immigrants from Eastern Asia (5.1%, a difference of 0.54%), and Indian (Asian) (5.1%, a difference of 0.73%).
| Demographics | Rating | Rank | Single Mother Households |
| Immigrants | Hong Kong | 100.0 /100 | #5 | Exceptional 4.8% |
| Immigrants | Singapore | 100.0 /100 | #6 | Exceptional 5.0% |
| Iranians | 100.0 /100 | #7 | Exceptional 5.0% |
| Immigrants | Ireland | 99.9 /100 | #8 | Exceptional 5.0% |
| Okinawans | 99.9 /100 | #9 | Exceptional 5.0% |
| Immigrants | Israel | 99.9 /100 | #10 | Exceptional 5.0% |
| Immigrants | China | 99.9 /100 | #11 | Exceptional 5.1% |
| Cypriots | 99.9 /100 | #12 | Exceptional 5.1% |
| Immigrants | India | 99.9 /100 | #13 | Exceptional 5.1% |
| Immigrants | Australia | 99.9 /100 | #14 | Exceptional 5.1% |
| Immigrants | Eastern Asia | 99.9 /100 | #15 | Exceptional 5.1% |
| Indians (Asian) | 99.9 /100 | #16 | Exceptional 5.1% |
| Soviet Union | 99.9 /100 | #17 | Exceptional 5.1% |
| Immigrants | Armenia | 99.9 /100 | #18 | Exceptional 5.2% |
| Chinese | 99.9 /100 | #19 | Exceptional 5.2% |