Arab vs African Single Mother Households
COMPARE
Arab
African
Single Mother Households
Single Mother Households Comparison
Arabs
Africans
6.0%
SINGLE MOTHER HOUSEHOLDS
84.0/ 100
METRIC RATING
145th/ 347
METRIC RANK
8.2%
SINGLE MOTHER HOUSEHOLDS
0.0/ 100
METRIC RATING
316th/ 347
METRIC RANK
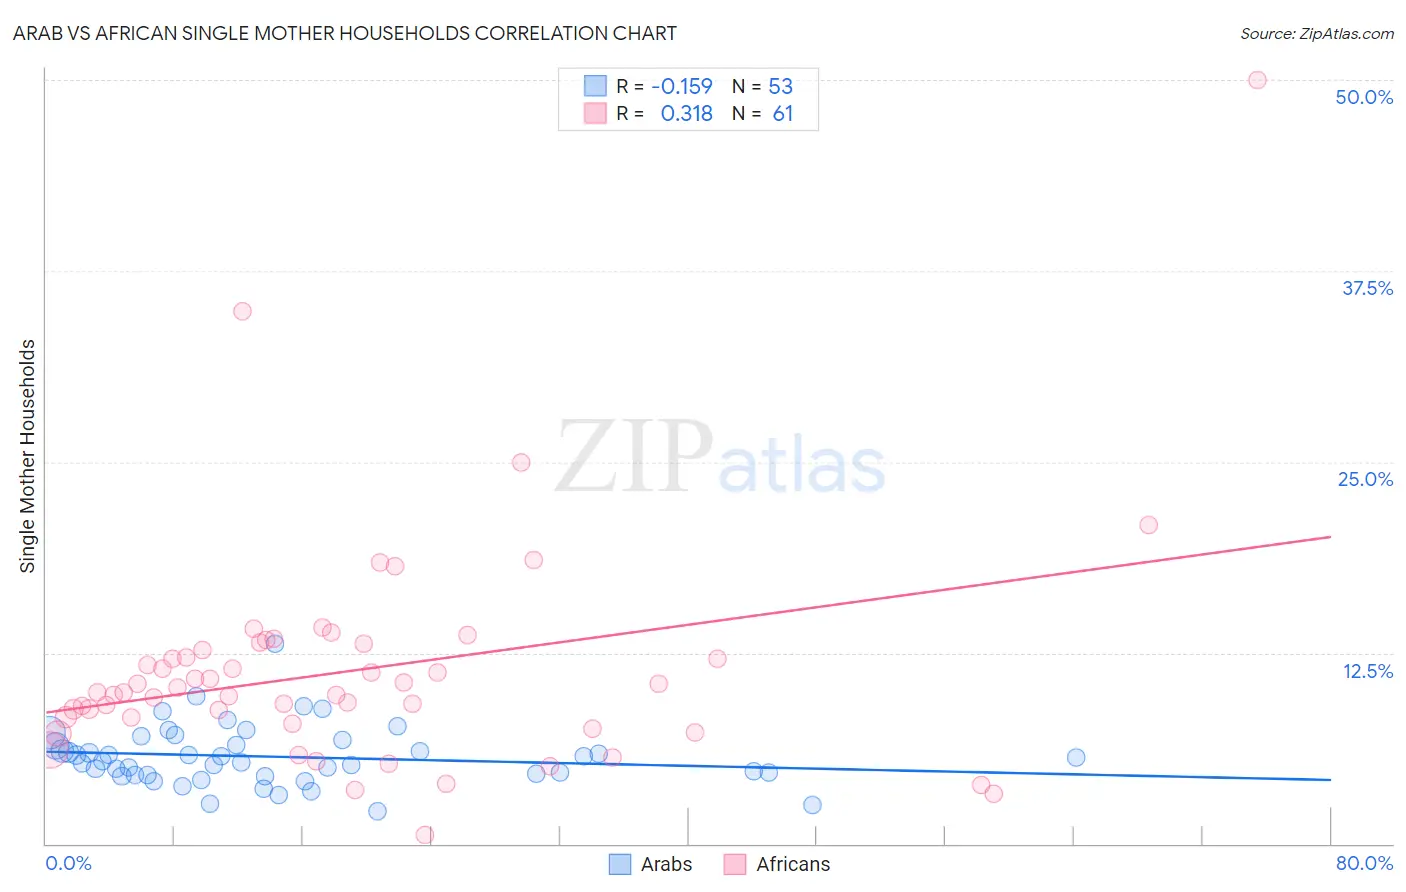
Arab vs African Single Mother Households Correlation Chart
The statistical analysis conducted on geographies consisting of 484,798,237 people shows a poor negative correlation between the proportion of Arabs and percentage of single mother households in the United States with a correlation coefficient (R) of -0.159 and weighted average of 6.0%. Similarly, the statistical analysis conducted on geographies consisting of 468,558,446 people shows a mild positive correlation between the proportion of Africans and percentage of single mother households in the United States with a correlation coefficient (R) of 0.318 and weighted average of 8.2%, a difference of 35.7%.
Single Mother Households Correlation Summary
| Measurement | Arab | African |
| Minimum | 2.1% | 0.60% |
| Maximum | 13.1% | 50.0% |
| Range | 10.9% | 49.4% |
| Mean | 5.7% | 11.3% |
| Median | 5.4% | 9.9% |
| Interquartile 25% (IQ1) | 4.5% | 8.1% |
| Interquartile 75% (IQ3) | 6.6% | 12.9% |
| Interquartile Range (IQR) | 2.1% | 4.8% |
| Standard Deviation (Sample) | 2.0% | 7.3% |
| Standard Deviation (Population) | 1.9% | 7.3% |
Similar Demographics by Single Mother Households
Demographics Similar to Arabs by Single Mother Households
In terms of single mother households, the demographic groups most similar to Arabs are Korean (6.0%, a difference of 0.090%), Immigrants from Iraq (6.0%, a difference of 0.19%), Immigrants from Egypt (6.0%, a difference of 0.23%), Tsimshian (6.0%, a difference of 0.28%), and French Canadian (6.0%, a difference of 0.29%).
| Demographics | Rating | Rank | Single Mother Households |
| Icelanders | 86.9 /100 | #138 | Excellent 6.0% |
| Syrians | 86.0 /100 | #139 | Excellent 6.0% |
| French | 85.7 /100 | #140 | Excellent 6.0% |
| Tsimshian | 85.2 /100 | #141 | Excellent 6.0% |
| Immigrants | Egypt | 85.0 /100 | #142 | Excellent 6.0% |
| Immigrants | Iraq | 84.8 /100 | #143 | Excellent 6.0% |
| Koreans | 84.4 /100 | #144 | Excellent 6.0% |
| Arabs | 84.0 /100 | #145 | Excellent 6.0% |
| French Canadians | 82.6 /100 | #146 | Excellent 6.0% |
| Immigrants | Jordan | 82.3 /100 | #147 | Excellent 6.0% |
| Scotch-Irish | 82.0 /100 | #148 | Excellent 6.0% |
| Immigrants | Albania | 81.5 /100 | #149 | Excellent 6.1% |
| Zimbabweans | 80.7 /100 | #150 | Excellent 6.1% |
| Immigrants | Southern Europe | 80.5 /100 | #151 | Excellent 6.1% |
| Pakistanis | 79.2 /100 | #152 | Good 6.1% |
Demographics Similar to Africans by Single Mother Households
In terms of single mother households, the demographic groups most similar to Africans are Immigrants from Honduras (8.2%, a difference of 0.14%), Immigrants from Western Africa (8.2%, a difference of 0.15%), Immigrants from Mexico (8.2%, a difference of 0.17%), Immigrants from Grenada (8.2%, a difference of 0.29%), and Bangladeshi (8.1%, a difference of 0.46%).
| Demographics | Rating | Rank | Single Mother Households |
| Cheyenne | 0.0 /100 | #309 | Tragic 8.1% |
| Hondurans | 0.0 /100 | #310 | Tragic 8.1% |
| Immigrants | Congo | 0.0 /100 | #311 | Tragic 8.1% |
| Bangladeshis | 0.0 /100 | #312 | Tragic 8.1% |
| Immigrants | Grenada | 0.0 /100 | #313 | Tragic 8.2% |
| Immigrants | Mexico | 0.0 /100 | #314 | Tragic 8.2% |
| Immigrants | Western Africa | 0.0 /100 | #315 | Tragic 8.2% |
| Africans | 0.0 /100 | #316 | Tragic 8.2% |
| Immigrants | Honduras | 0.0 /100 | #317 | Tragic 8.2% |
| Senegalese | 0.0 /100 | #318 | Tragic 8.2% |
| Jamaicans | 0.0 /100 | #319 | Tragic 8.2% |
| Bahamians | 0.0 /100 | #320 | Tragic 8.3% |
| Immigrants | Senegal | 0.0 /100 | #321 | Tragic 8.3% |
| Pima | 0.0 /100 | #322 | Tragic 8.3% |
| Haitians | 0.0 /100 | #323 | Tragic 8.3% |