Alaskan Athabascan vs Immigrants from Israel Family Households
COMPARE
Alaskan Athabascan
Immigrants from Israel
Family Households
Family Households Comparison
Alaskan Athabascans
Immigrants from Israel
61.8%
FAMILY HOUSEHOLDS
0.0/ 100
METRIC RATING
318th/ 347
METRIC RANK
63.4%
FAMILY HOUSEHOLDS
1.8/ 100
METRIC RATING
242nd/ 347
METRIC RANK
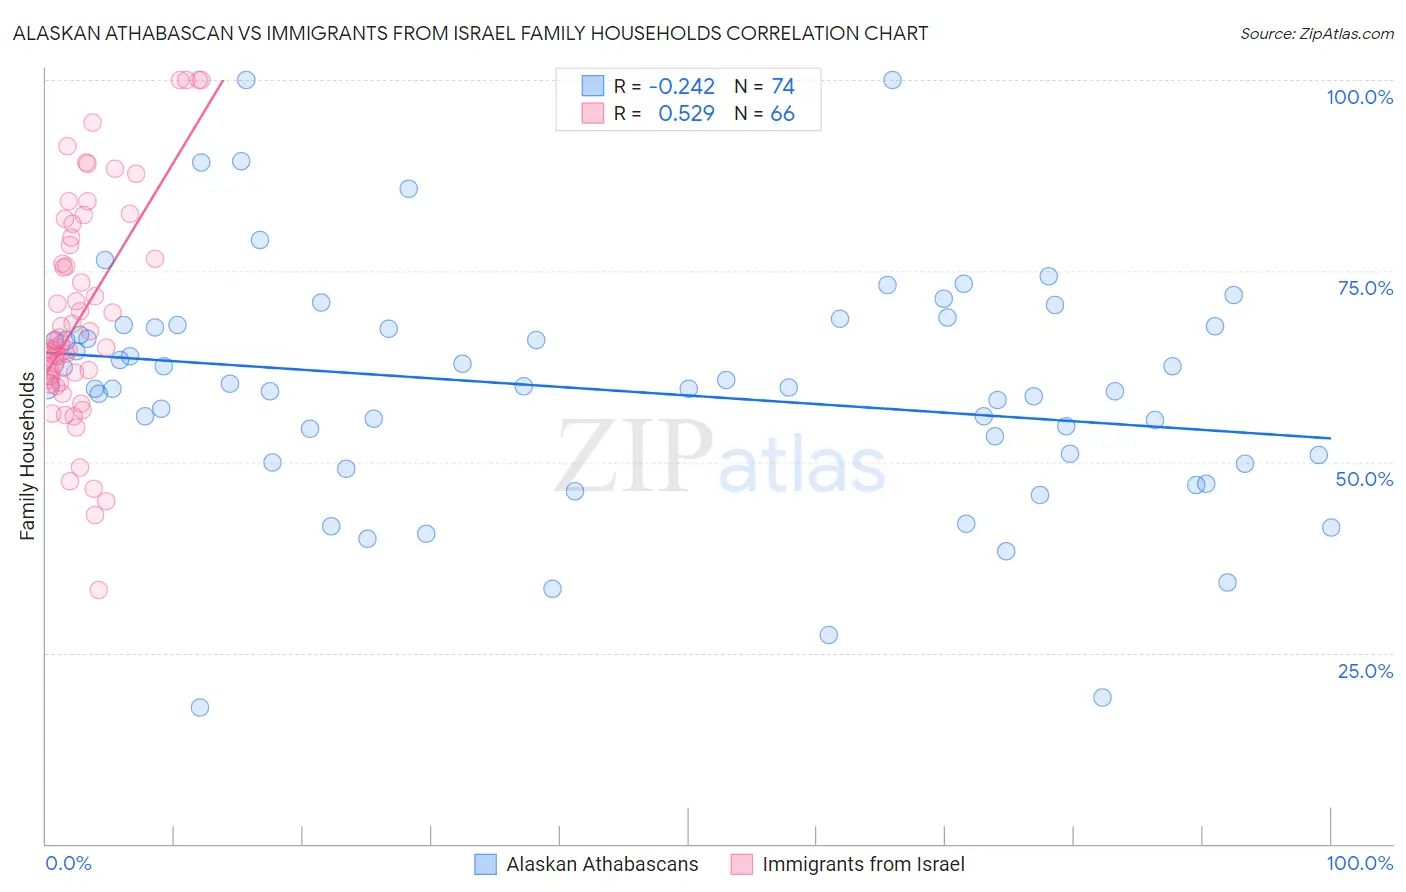
Alaskan Athabascan vs Immigrants from Israel Family Households Correlation Chart
The statistical analysis conducted on geographies consisting of 45,815,060 people shows a weak negative correlation between the proportion of Alaskan Athabascans and percentage of family households in the United States with a correlation coefficient (R) of -0.242 and weighted average of 61.8%. Similarly, the statistical analysis conducted on geographies consisting of 209,979,754 people shows a substantial positive correlation between the proportion of Immigrants from Israel and percentage of family households in the United States with a correlation coefficient (R) of 0.529 and weighted average of 63.4%, a difference of 2.6%.
Family Households Correlation Summary
| Measurement | Alaskan Athabascan | Immigrants from Israel |
| Minimum | 17.8% | 33.2% |
| Maximum | 100.0% | 100.0% |
| Range | 82.2% | 66.8% |
| Mean | 59.5% | 69.4% |
| Median | 59.8% | 65.6% |
| Interquartile 25% (IQ1) | 50.9% | 60.8% |
| Interquartile 75% (IQ3) | 67.7% | 79.4% |
| Interquartile Range (IQR) | 16.7% | 18.6% |
| Standard Deviation (Sample) | 15.5% | 14.6% |
| Standard Deviation (Population) | 15.4% | 14.5% |
Similar Demographics by Family Households
Demographics Similar to Alaskan Athabascans by Family Households
In terms of family households, the demographic groups most similar to Alaskan Athabascans are Cape Verdean (61.8%, a difference of 0.060%), Immigrants from Bosnia and Herzegovina (61.9%, a difference of 0.080%), Immigrants from Middle Africa (61.9%, a difference of 0.12%), Moroccan (61.9%, a difference of 0.16%), and Ugandan (61.7%, a difference of 0.18%).
| Demographics | Rating | Rank | Family Households |
| Immigrants | Morocco | 0.0 /100 | #311 | Tragic 62.0% |
| Immigrants | Latvia | 0.0 /100 | #312 | Tragic 62.0% |
| Liberians | 0.0 /100 | #313 | Tragic 62.0% |
| Immigrants | Cabo Verde | 0.0 /100 | #314 | Tragic 61.9% |
| Moroccans | 0.0 /100 | #315 | Tragic 61.9% |
| Immigrants | Middle Africa | 0.0 /100 | #316 | Tragic 61.9% |
| Immigrants | Bosnia and Herzegovina | 0.0 /100 | #317 | Tragic 61.9% |
| Alaskan Athabascans | 0.0 /100 | #318 | Tragic 61.8% |
| Cape Verdeans | 0.0 /100 | #319 | Tragic 61.8% |
| Ugandans | 0.0 /100 | #320 | Tragic 61.7% |
| Alsatians | 0.0 /100 | #321 | Tragic 61.7% |
| Immigrants | Serbia | 0.0 /100 | #322 | Tragic 61.6% |
| Tlingit-Haida | 0.0 /100 | #323 | Tragic 61.6% |
| Immigrants | West Indies | 0.0 /100 | #324 | Tragic 61.6% |
| Immigrants | Switzerland | 0.0 /100 | #325 | Tragic 61.6% |
Demographics Similar to Immigrants from Israel by Family Households
In terms of family households, the demographic groups most similar to Immigrants from Israel are Aleut (63.4%, a difference of 0.010%), South African (63.4%, a difference of 0.010%), Immigrants from St. Vincent and the Grenadines (63.4%, a difference of 0.010%), Immigrants from Czechoslovakia (63.4%, a difference of 0.010%), and Immigrants from Zimbabwe (63.5%, a difference of 0.040%).
| Demographics | Rating | Rank | Family Households |
| Albanians | 2.2 /100 | #235 | Tragic 63.5% |
| Ghanaians | 2.1 /100 | #236 | Tragic 63.5% |
| Comanche | 2.1 /100 | #237 | Tragic 63.5% |
| Immigrants | Zimbabwe | 2.0 /100 | #238 | Tragic 63.5% |
| Aleuts | 1.9 /100 | #239 | Tragic 63.4% |
| South Africans | 1.9 /100 | #240 | Tragic 63.4% |
| Immigrants | St. Vincent and the Grenadines | 1.9 /100 | #241 | Tragic 63.4% |
| Immigrants | Israel | 1.8 /100 | #242 | Tragic 63.4% |
| Immigrants | Czechoslovakia | 1.8 /100 | #243 | Tragic 63.4% |
| Eastern Europeans | 1.6 /100 | #244 | Tragic 63.4% |
| Immigrants | Dominica | 1.6 /100 | #245 | Tragic 63.4% |
| Immigrants | Ghana | 1.6 /100 | #246 | Tragic 63.4% |
| Immigrants | Uzbekistan | 1.5 /100 | #247 | Tragic 63.4% |
| Dominicans | 1.5 /100 | #248 | Tragic 63.4% |
| Russians | 1.4 /100 | #249 | Tragic 63.4% |