Alaskan Athabascan vs Immigrants from Trinidad and Tobago Family Households
COMPARE
Alaskan Athabascan
Immigrants from Trinidad and Tobago
Family Households
Family Households Comparison
Alaskan Athabascans
Immigrants from Trinidad and Tobago
61.8%
FAMILY HOUSEHOLDS
0.0/ 100
METRIC RATING
318th/ 347
METRIC RANK
64.2%
FAMILY HOUSEHOLDS
34.9/ 100
METRIC RATING
181st/ 347
METRIC RANK
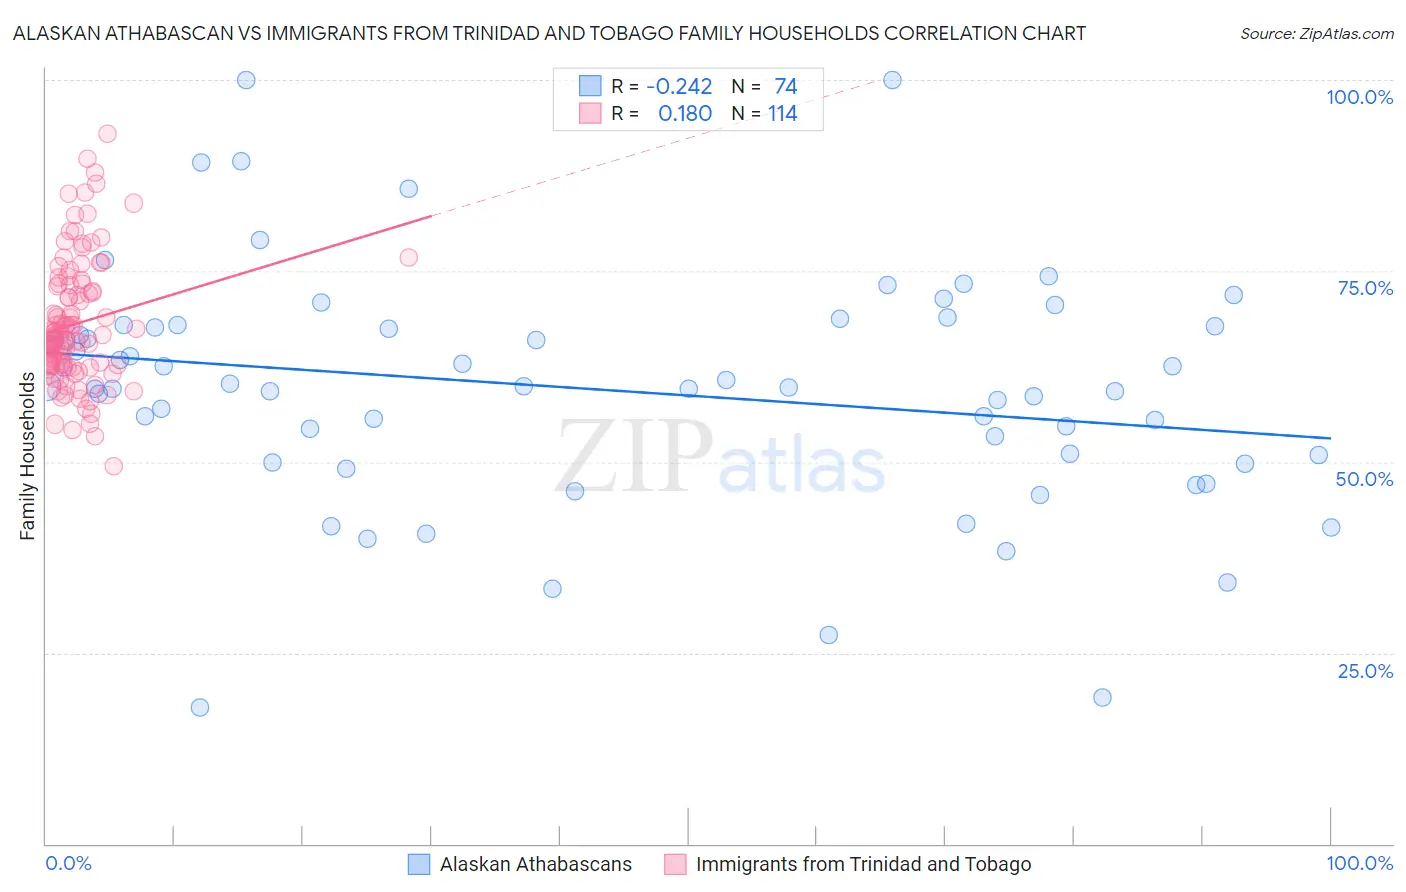
Alaskan Athabascan vs Immigrants from Trinidad and Tobago Family Households Correlation Chart
The statistical analysis conducted on geographies consisting of 45,815,060 people shows a weak negative correlation between the proportion of Alaskan Athabascans and percentage of family households in the United States with a correlation coefficient (R) of -0.242 and weighted average of 61.8%. Similarly, the statistical analysis conducted on geographies consisting of 223,484,362 people shows a poor positive correlation between the proportion of Immigrants from Trinidad and Tobago and percentage of family households in the United States with a correlation coefficient (R) of 0.180 and weighted average of 64.2%, a difference of 3.8%.
Family Households Correlation Summary
| Measurement | Alaskan Athabascan | Immigrants from Trinidad and Tobago |
| Minimum | 17.8% | 49.5% |
| Maximum | 100.0% | 92.9% |
| Range | 82.2% | 43.4% |
| Mean | 59.5% | 68.1% |
| Median | 59.8% | 66.5% |
| Interquartile 25% (IQ1) | 50.9% | 62.6% |
| Interquartile 75% (IQ3) | 67.7% | 73.2% |
| Interquartile Range (IQR) | 16.7% | 10.5% |
| Standard Deviation (Sample) | 15.5% | 8.3% |
| Standard Deviation (Population) | 15.4% | 8.2% |
Similar Demographics by Family Households
Demographics Similar to Alaskan Athabascans by Family Households
In terms of family households, the demographic groups most similar to Alaskan Athabascans are Cape Verdean (61.8%, a difference of 0.060%), Immigrants from Bosnia and Herzegovina (61.9%, a difference of 0.080%), Immigrants from Middle Africa (61.9%, a difference of 0.12%), Moroccan (61.9%, a difference of 0.16%), and Ugandan (61.7%, a difference of 0.18%).
| Demographics | Rating | Rank | Family Households |
| Immigrants | Morocco | 0.0 /100 | #311 | Tragic 62.0% |
| Immigrants | Latvia | 0.0 /100 | #312 | Tragic 62.0% |
| Liberians | 0.0 /100 | #313 | Tragic 62.0% |
| Immigrants | Cabo Verde | 0.0 /100 | #314 | Tragic 61.9% |
| Moroccans | 0.0 /100 | #315 | Tragic 61.9% |
| Immigrants | Middle Africa | 0.0 /100 | #316 | Tragic 61.9% |
| Immigrants | Bosnia and Herzegovina | 0.0 /100 | #317 | Tragic 61.9% |
| Alaskan Athabascans | 0.0 /100 | #318 | Tragic 61.8% |
| Cape Verdeans | 0.0 /100 | #319 | Tragic 61.8% |
| Ugandans | 0.0 /100 | #320 | Tragic 61.7% |
| Alsatians | 0.0 /100 | #321 | Tragic 61.7% |
| Immigrants | Serbia | 0.0 /100 | #322 | Tragic 61.6% |
| Tlingit-Haida | 0.0 /100 | #323 | Tragic 61.6% |
| Immigrants | West Indies | 0.0 /100 | #324 | Tragic 61.6% |
| Immigrants | Switzerland | 0.0 /100 | #325 | Tragic 61.6% |
Demographics Similar to Immigrants from Trinidad and Tobago by Family Households
In terms of family households, the demographic groups most similar to Immigrants from Trinidad and Tobago are Immigrants from Honduras (64.2%, a difference of 0.0%), Ukrainian (64.2%, a difference of 0.0%), Creek (64.2%, a difference of 0.010%), Puerto Rican (64.2%, a difference of 0.020%), and Immigrants from Ukraine (64.2%, a difference of 0.050%).
| Demographics | Rating | Rank | Family Households |
| Immigrants | Germany | 50.0 /100 | #174 | Average 64.3% |
| Bangladeshis | 44.3 /100 | #175 | Average 64.3% |
| Vietnamese | 43.6 /100 | #176 | Average 64.2% |
| Immigrants | Micronesia | 42.3 /100 | #177 | Average 64.2% |
| Jamaicans | 40.6 /100 | #178 | Average 64.2% |
| Immigrants | Ukraine | 38.2 /100 | #179 | Fair 64.2% |
| Immigrants | Honduras | 35.0 /100 | #180 | Fair 64.2% |
| Immigrants | Trinidad and Tobago | 34.9 /100 | #181 | Fair 64.2% |
| Ukrainians | 34.6 /100 | #182 | Fair 64.2% |
| Creek | 34.1 /100 | #183 | Fair 64.2% |
| Puerto Ricans | 33.4 /100 | #184 | Fair 64.2% |
| Immigrants | Iran | 30.4 /100 | #185 | Fair 64.1% |
| Spanish Americans | 30.1 /100 | #186 | Fair 64.1% |
| Northern Europeans | 28.2 /100 | #187 | Fair 64.1% |
| Paraguayans | 26.7 /100 | #188 | Fair 64.1% |