Colville vs Immigrants from Israel Family Households
COMPARE
Colville
Immigrants from Israel
Family Households
Family Households Comparison
Colville
Immigrants from Israel
63.2%
FAMILY HOUSEHOLDS
0.5/ 100
METRIC RATING
265th/ 347
METRIC RANK
63.4%
FAMILY HOUSEHOLDS
1.8/ 100
METRIC RATING
242nd/ 347
METRIC RANK
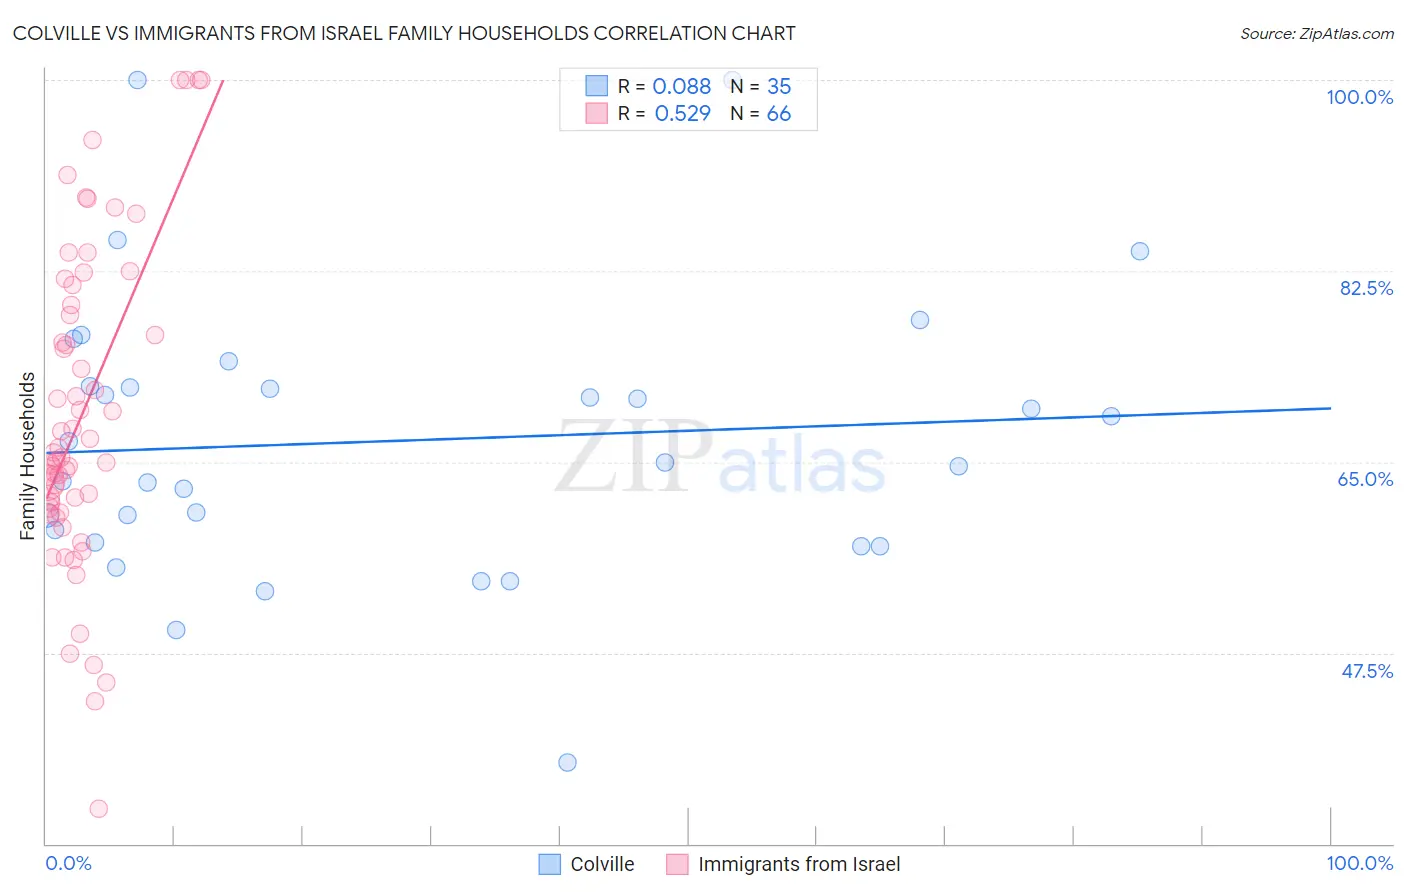
Colville vs Immigrants from Israel Family Households Correlation Chart
The statistical analysis conducted on geographies consisting of 34,683,092 people shows a slight positive correlation between the proportion of Colville and percentage of family households in the United States with a correlation coefficient (R) of 0.088 and weighted average of 63.2%. Similarly, the statistical analysis conducted on geographies consisting of 209,979,754 people shows a substantial positive correlation between the proportion of Immigrants from Israel and percentage of family households in the United States with a correlation coefficient (R) of 0.529 and weighted average of 63.4%, a difference of 0.45%.
Family Households Correlation Summary
| Measurement | Colville | Immigrants from Israel |
| Minimum | 37.5% | 33.2% |
| Maximum | 100.0% | 100.0% |
| Range | 62.5% | 66.8% |
| Mean | 66.9% | 69.4% |
| Median | 65.0% | 65.6% |
| Interquartile 25% (IQ1) | 57.6% | 60.8% |
| Interquartile 75% (IQ3) | 72.0% | 79.4% |
| Interquartile Range (IQR) | 14.4% | 18.6% |
| Standard Deviation (Sample) | 12.9% | 14.6% |
| Standard Deviation (Population) | 12.7% | 14.5% |
Similar Demographics by Family Households
Demographics Similar to Colville by Family Households
In terms of family households, the demographic groups most similar to Colville are Kenyan (63.2%, a difference of 0.010%), Immigrants from Western Africa (63.1%, a difference of 0.010%), Cheyenne (63.2%, a difference of 0.020%), Immigrants from Ireland (63.2%, a difference of 0.040%), and Immigrants from Russia (63.2%, a difference of 0.050%).
| Demographics | Rating | Rank | Family Households |
| Immigrants | Barbados | 0.7 /100 | #258 | Tragic 63.2% |
| Immigrants | Western Europe | 0.6 /100 | #259 | Tragic 63.2% |
| Cypriots | 0.6 /100 | #260 | Tragic 63.2% |
| Immigrants | Russia | 0.6 /100 | #261 | Tragic 63.2% |
| Immigrants | Ireland | 0.6 /100 | #262 | Tragic 63.2% |
| Cheyenne | 0.5 /100 | #263 | Tragic 63.2% |
| Kenyans | 0.5 /100 | #264 | Tragic 63.2% |
| Colville | 0.5 /100 | #265 | Tragic 63.2% |
| Immigrants | Western Africa | 0.5 /100 | #266 | Tragic 63.1% |
| Israelis | 0.4 /100 | #267 | Tragic 63.1% |
| Immigrants | Singapore | 0.4 /100 | #268 | Tragic 63.1% |
| Yugoslavians | 0.4 /100 | #269 | Tragic 63.1% |
| Immigrants | Austria | 0.3 /100 | #270 | Tragic 63.1% |
| Immigrants | Croatia | 0.3 /100 | #271 | Tragic 63.1% |
| Immigrants | Turkey | 0.3 /100 | #272 | Tragic 63.1% |
Demographics Similar to Immigrants from Israel by Family Households
In terms of family households, the demographic groups most similar to Immigrants from Israel are Aleut (63.4%, a difference of 0.010%), South African (63.4%, a difference of 0.010%), Immigrants from St. Vincent and the Grenadines (63.4%, a difference of 0.010%), Immigrants from Czechoslovakia (63.4%, a difference of 0.010%), and Immigrants from Zimbabwe (63.5%, a difference of 0.040%).
| Demographics | Rating | Rank | Family Households |
| Albanians | 2.2 /100 | #235 | Tragic 63.5% |
| Ghanaians | 2.1 /100 | #236 | Tragic 63.5% |
| Comanche | 2.1 /100 | #237 | Tragic 63.5% |
| Immigrants | Zimbabwe | 2.0 /100 | #238 | Tragic 63.5% |
| Aleuts | 1.9 /100 | #239 | Tragic 63.4% |
| South Africans | 1.9 /100 | #240 | Tragic 63.4% |
| Immigrants | St. Vincent and the Grenadines | 1.9 /100 | #241 | Tragic 63.4% |
| Immigrants | Israel | 1.8 /100 | #242 | Tragic 63.4% |
| Immigrants | Czechoslovakia | 1.8 /100 | #243 | Tragic 63.4% |
| Eastern Europeans | 1.6 /100 | #244 | Tragic 63.4% |
| Immigrants | Dominica | 1.6 /100 | #245 | Tragic 63.4% |
| Immigrants | Ghana | 1.6 /100 | #246 | Tragic 63.4% |
| Immigrants | Uzbekistan | 1.5 /100 | #247 | Tragic 63.4% |
| Dominicans | 1.5 /100 | #248 | Tragic 63.4% |
| Russians | 1.4 /100 | #249 | Tragic 63.4% |