Alaskan Athabascan vs Immigrants from Kuwait Family Households
COMPARE
Alaskan Athabascan
Immigrants from Kuwait
Family Households
Family Households Comparison
Alaskan Athabascans
Immigrants from Kuwait
61.8%
FAMILY HOUSEHOLDS
0.0/ 100
METRIC RATING
318th/ 347
METRIC RANK
62.4%
FAMILY HOUSEHOLDS
0.0/ 100
METRIC RATING
299th/ 347
METRIC RANK
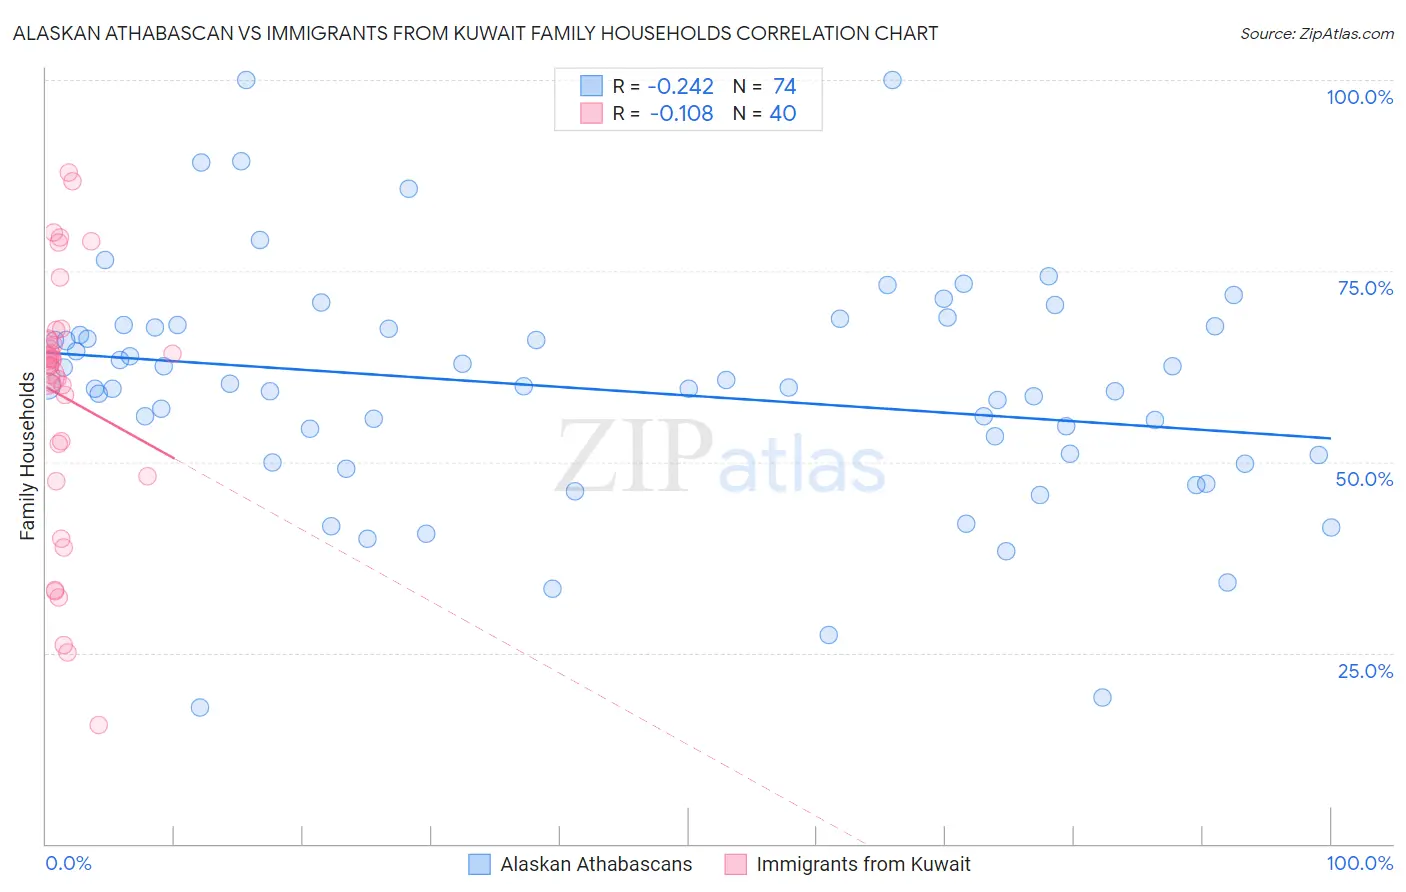
Alaskan Athabascan vs Immigrants from Kuwait Family Households Correlation Chart
The statistical analysis conducted on geographies consisting of 45,815,060 people shows a weak negative correlation between the proportion of Alaskan Athabascans and percentage of family households in the United States with a correlation coefficient (R) of -0.242 and weighted average of 61.8%. Similarly, the statistical analysis conducted on geographies consisting of 136,888,250 people shows a poor negative correlation between the proportion of Immigrants from Kuwait and percentage of family households in the United States with a correlation coefficient (R) of -0.108 and weighted average of 62.4%, a difference of 0.92%.
Family Households Correlation Summary
| Measurement | Alaskan Athabascan | Immigrants from Kuwait |
| Minimum | 17.8% | 15.6% |
| Maximum | 100.0% | 87.9% |
| Range | 82.2% | 72.2% |
| Mean | 59.5% | 58.5% |
| Median | 59.8% | 63.0% |
| Interquartile 25% (IQ1) | 50.9% | 50.2% |
| Interquartile 75% (IQ3) | 67.7% | 66.0% |
| Interquartile Range (IQR) | 16.7% | 15.8% |
| Standard Deviation (Sample) | 15.5% | 17.0% |
| Standard Deviation (Population) | 15.4% | 16.8% |
Demographics Similar to Alaskan Athabascans and Immigrants from Kuwait by Family Households
In terms of family households, the demographic groups most similar to Alaskan Athabascans are Immigrants from Bosnia and Herzegovina (61.9%, a difference of 0.080%), Immigrants from Middle Africa (61.9%, a difference of 0.12%), Moroccan (61.9%, a difference of 0.16%), Immigrants from Cabo Verde (61.9%, a difference of 0.21%), and Immigrants from Latvia (62.0%, a difference of 0.26%). Similarly, the demographic groups most similar to Immigrants from Kuwait are Immigrants from Africa (62.4%, a difference of 0.0%), Immigrants from Albania (62.4%, a difference of 0.030%), Immigrants from Spain (62.4%, a difference of 0.060%), Immigrants from Kenya (62.3%, a difference of 0.070%), and Cree (62.3%, a difference of 0.12%).
| Demographics | Rating | Rank | Family Households |
| Immigrants | Spain | 0.0 /100 | #298 | Tragic 62.4% |
| Immigrants | Kuwait | 0.0 /100 | #299 | Tragic 62.4% |
| Immigrants | Africa | 0.0 /100 | #300 | Tragic 62.4% |
| Immigrants | Albania | 0.0 /100 | #301 | Tragic 62.4% |
| Immigrants | Kenya | 0.0 /100 | #302 | Tragic 62.3% |
| Cree | 0.0 /100 | #303 | Tragic 62.3% |
| Iroquois | 0.0 /100 | #304 | Tragic 62.2% |
| Bermudans | 0.0 /100 | #305 | Tragic 62.2% |
| Africans | 0.0 /100 | #306 | Tragic 62.1% |
| Immigrants | Norway | 0.0 /100 | #307 | Tragic 62.1% |
| Chippewa | 0.0 /100 | #308 | Tragic 62.1% |
| Sub-Saharan Africans | 0.0 /100 | #309 | Tragic 62.1% |
| Immigrants | Liberia | 0.0 /100 | #310 | Tragic 62.0% |
| Immigrants | Morocco | 0.0 /100 | #311 | Tragic 62.0% |
| Immigrants | Latvia | 0.0 /100 | #312 | Tragic 62.0% |
| Liberians | 0.0 /100 | #313 | Tragic 62.0% |
| Immigrants | Cabo Verde | 0.0 /100 | #314 | Tragic 61.9% |
| Moroccans | 0.0 /100 | #315 | Tragic 61.9% |
| Immigrants | Middle Africa | 0.0 /100 | #316 | Tragic 61.9% |
| Immigrants | Bosnia and Herzegovina | 0.0 /100 | #317 | Tragic 61.9% |
| Alaskan Athabascans | 0.0 /100 | #318 | Tragic 61.8% |