Alaskan Athabascan vs Immigrants from Hungary Family Households
COMPARE
Alaskan Athabascan
Immigrants from Hungary
Family Households
Family Households Comparison
Alaskan Athabascans
Immigrants from Hungary
61.8%
FAMILY HOUSEHOLDS
0.0/ 100
METRIC RATING
318th/ 347
METRIC RANK
63.6%
FAMILY HOUSEHOLDS
4.3/ 100
METRIC RATING
225th/ 347
METRIC RANK
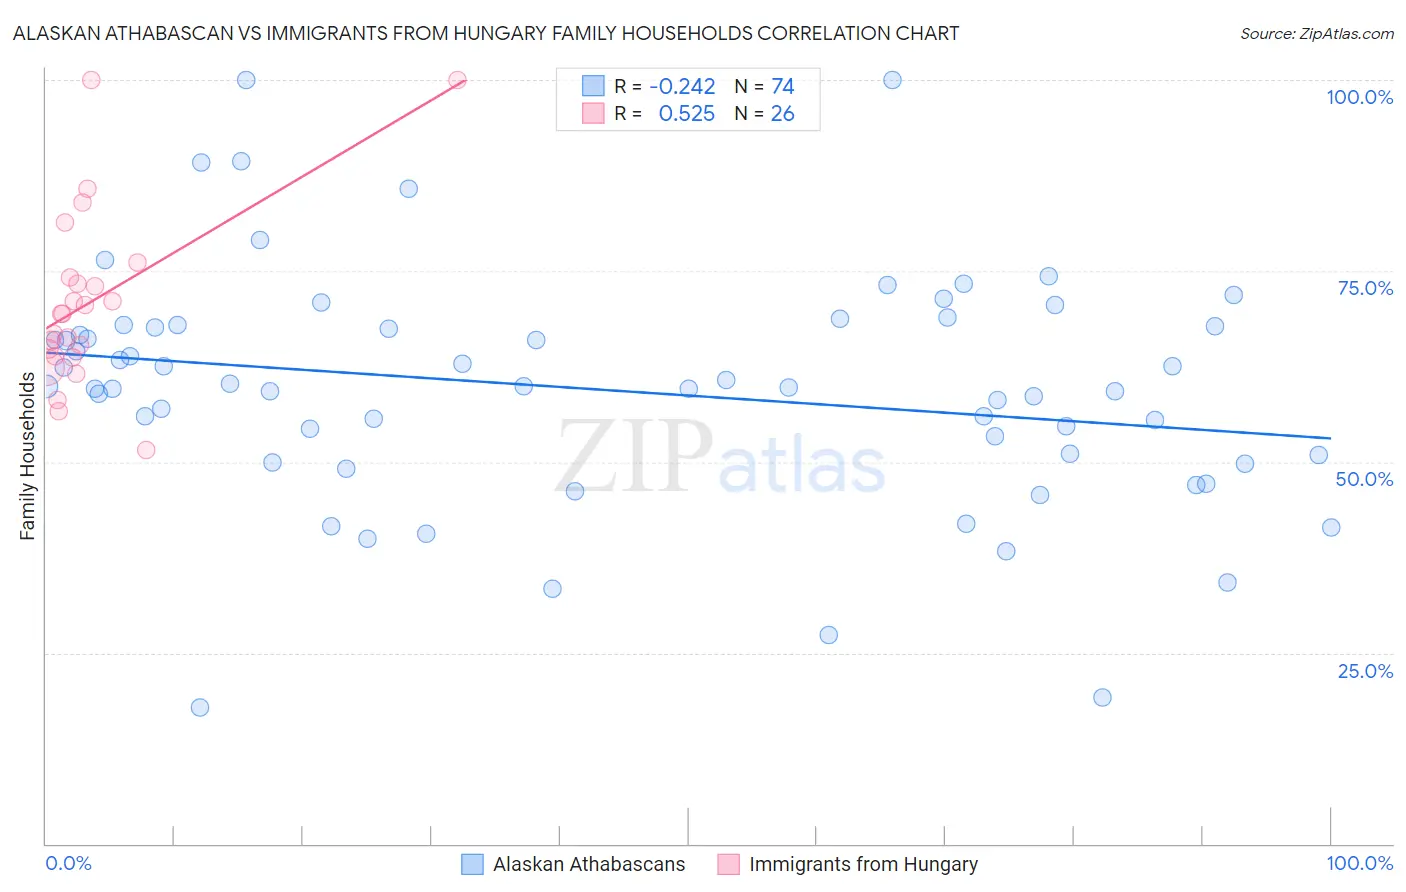
Alaskan Athabascan vs Immigrants from Hungary Family Households Correlation Chart
The statistical analysis conducted on geographies consisting of 45,815,060 people shows a weak negative correlation between the proportion of Alaskan Athabascans and percentage of family households in the United States with a correlation coefficient (R) of -0.242 and weighted average of 61.8%. Similarly, the statistical analysis conducted on geographies consisting of 195,664,672 people shows a substantial positive correlation between the proportion of Immigrants from Hungary and percentage of family households in the United States with a correlation coefficient (R) of 0.525 and weighted average of 63.6%, a difference of 2.9%.
Family Households Correlation Summary
| Measurement | Alaskan Athabascan | Immigrants from Hungary |
| Minimum | 17.8% | 51.6% |
| Maximum | 100.0% | 100.0% |
| Range | 82.2% | 48.4% |
| Mean | 59.5% | 71.0% |
| Median | 59.8% | 69.4% |
| Interquartile 25% (IQ1) | 50.9% | 63.9% |
| Interquartile 75% (IQ3) | 67.7% | 74.2% |
| Interquartile Range (IQR) | 16.7% | 10.3% |
| Standard Deviation (Sample) | 15.5% | 11.6% |
| Standard Deviation (Population) | 15.4% | 11.4% |
Similar Demographics by Family Households
Demographics Similar to Alaskan Athabascans by Family Households
In terms of family households, the demographic groups most similar to Alaskan Athabascans are Cape Verdean (61.8%, a difference of 0.060%), Immigrants from Bosnia and Herzegovina (61.9%, a difference of 0.080%), Immigrants from Middle Africa (61.9%, a difference of 0.12%), Moroccan (61.9%, a difference of 0.16%), and Ugandan (61.7%, a difference of 0.18%).
| Demographics | Rating | Rank | Family Households |
| Immigrants | Morocco | 0.0 /100 | #311 | Tragic 62.0% |
| Immigrants | Latvia | 0.0 /100 | #312 | Tragic 62.0% |
| Liberians | 0.0 /100 | #313 | Tragic 62.0% |
| Immigrants | Cabo Verde | 0.0 /100 | #314 | Tragic 61.9% |
| Moroccans | 0.0 /100 | #315 | Tragic 61.9% |
| Immigrants | Middle Africa | 0.0 /100 | #316 | Tragic 61.9% |
| Immigrants | Bosnia and Herzegovina | 0.0 /100 | #317 | Tragic 61.9% |
| Alaskan Athabascans | 0.0 /100 | #318 | Tragic 61.8% |
| Cape Verdeans | 0.0 /100 | #319 | Tragic 61.8% |
| Ugandans | 0.0 /100 | #320 | Tragic 61.7% |
| Alsatians | 0.0 /100 | #321 | Tragic 61.7% |
| Immigrants | Serbia | 0.0 /100 | #322 | Tragic 61.6% |
| Tlingit-Haida | 0.0 /100 | #323 | Tragic 61.6% |
| Immigrants | West Indies | 0.0 /100 | #324 | Tragic 61.6% |
| Immigrants | Switzerland | 0.0 /100 | #325 | Tragic 61.6% |
Demographics Similar to Immigrants from Hungary by Family Households
In terms of family households, the demographic groups most similar to Immigrants from Hungary are Turkish (63.6%, a difference of 0.010%), Immigrants from Bahamas (63.6%, a difference of 0.010%), Trinidadian and Tobagonian (63.6%, a difference of 0.020%), Blackfeet (63.6%, a difference of 0.070%), and French Canadian (63.7%, a difference of 0.080%).
| Demographics | Rating | Rank | Family Households |
| Marshallese | 6.9 /100 | #218 | Tragic 63.7% |
| Macedonians | 6.5 /100 | #219 | Tragic 63.7% |
| Immigrants | Europe | 6.4 /100 | #220 | Tragic 63.7% |
| Immigrants | South Africa | 5.9 /100 | #221 | Tragic 63.7% |
| Immigrants | Belarus | 5.5 /100 | #222 | Tragic 63.7% |
| French Canadians | 5.4 /100 | #223 | Tragic 63.7% |
| Turks | 4.5 /100 | #224 | Tragic 63.6% |
| Immigrants | Hungary | 4.3 /100 | #225 | Tragic 63.6% |
| Immigrants | Bahamas | 4.2 /100 | #226 | Tragic 63.6% |
| Trinidadians and Tobagonians | 4.1 /100 | #227 | Tragic 63.6% |
| Blackfeet | 3.6 /100 | #228 | Tragic 63.6% |
| Bulgarians | 3.4 /100 | #229 | Tragic 63.6% |
| Immigrants | Brazil | 3.0 /100 | #230 | Tragic 63.6% |
| Immigrants | Greece | 2.9 /100 | #231 | Tragic 63.5% |
| Immigrants | Northern Africa | 2.6 /100 | #232 | Tragic 63.5% |