Immigrants from Ukraine vs Immigrants from Israel Family Households

COMPARE

Immigrants from Ukraine
Race
Ancestry
AfghanAfricanAlaska NativeAlaskan AthabascanAlbanianAleutAlsatianAmericanApacheArabArapahoArgentineanArmenianAssyrian/Chaldean/SyriacAustralianAustrianBahamianBangladeshiBarbadianBasqueBelgianBelizeanBermudanBhutaneseBlackfeetBolivianBrazilianBritishBritish West IndianBulgarianBurmeseCajunCambodianCanadianCape VerdeanCarpatho RusynCelticCentral AmericanCentral American IndianCherokeeCheyenneChickasawChileanChineseChippewaChoctawColombianColvilleComancheCosta RicanCreeCreekCroatianCrowCubanCypriotCzechCzechoslovakianDanishDelawareDominicanDutchDutch West IndianEastern EuropeanEcuadorianEgyptianEnglishEstonianEthiopianEuropeanFijianFilipinoFinnishFrenchFrench American IndianFrench CanadianGermanGerman RussianGhanaianGreekGuamanian/ChamorroGuatemalanGuyaneseHaitianHmongHonduranHopiHoumaHungarianIcelanderIndian (Asian)IndonesianInupiatIranianIraqiIrishIroquoisIsraeliItalianJamaicanJapaneseJordanianKenyanKiowaKoreanLaotianLatvianLebaneseLiberianLithuanianLumbeeLuxembourgerMacedonianMalaysianMalteseMarshalleseMenomineeMexicanMexican American IndianMongolianMoroccanNative HawaiianNavajoNepaleseNew ZealanderNicaraguanNigerianNorthern EuropeanNorwegianOkinawanOsageOttawaPaiutePakistaniPalestinianPanamanianParaguayanPennsylvania GermanPeruvianPimaPolishPortuguesePotawatomiPuebloPuerto RicanPuget Sound SalishRomanianRussianSalvadoranSamoanScandinavianScotch-IrishScottishSeminoleSenegaleseSerbianShoshoneSierra LeoneanSiouxSlavicSlovakSloveneSomaliSouth AfricanSouth AmericanSouth American IndianSoviet UnionSpaniardSpanishSpanish AmericanSpanish American IndianSri LankanSubsaharan AfricanSudaneseSwedishSwissSyrianTaiwaneseThaiTlingit-HaidaTohono O'OdhamTonganTrinidadian and TobagonianTsimshianTurkishU.S. Virgin IslanderUgandanUkrainianUruguayanUteVenezuelanVietnameseWelshWest IndianYakamaYaquiYugoslavianYumanYup'ikZimbabwean
Immigration
NonimmigrantsImmigrantsAfghanistanAfricaAlbaniaArgentinaArmeniaAsiaAustraliaAustriaBahamasBangladeshBarbadosBelarusBelgiumBelizeBoliviaBosnia and HerzegovinaBrazilBulgariaBurma/MyanmarCabo VerdeCambodiaCameroonCanadaCaribbeanCentral AmericaChileChinaColombiaCongoCosta RicaCroatiaCubaCzechoslovakiaDenmarkDominicaDominican RepublicEastern AfricaEastern AsiaEastern EuropeEcuadorEgyptEl SalvadorEnglandEritreaEthiopiaEuropeFijiFranceGermanyGhanaGreeceGrenadaGuatemalaGuyanaHaitiHondurasHong KongHungaryIndiaIndonesiaIranIraqIrelandItalyJamaicaJapanJordanKazakhstanKenyaKoreaKuwaitLaosLatin AmericaLatviaLebanonLiberiaLithuaniaMalaysiaMexicoMicronesiaMiddle AfricaMoldovaMoroccoNepalNetherlandsNicaraguaNigeriaNorth AmericaNorth MacedoniaNorthern AfricaNorthern EuropeNorwayOceaniaPakistanPanamaPeruPhilippinesPolandPortugalRomaniaRussiaSaudi ArabiaScotlandSenegalSerbiaSierra LeoneSingaporeSomaliaSouth AfricaSouth AmericaSouth Central AsiaSouth Eastern AsiaSouthern EuropeSpainSri LankaSt. Vincent and the GrenadinesSudanSwedenSwitzerlandSyriaTaiwanThailandTrinidad and TobagoTurkeyUgandaUkraineUruguayUzbekistanVenezuelaVietnamWest IndiesWestern AfricaWestern AsiaWestern EuropeYemenZaireZimbabweAzores
Immigrants from Israel
Race
Ancestry
AfghanAfricanAlaska NativeAlaskan AthabascanAlbanianAleutAlsatianAmericanApacheArabArapahoArgentineanArmenianAssyrian/Chaldean/SyriacAustralianAustrianBahamianBangladeshiBarbadianBasqueBelgianBelizeanBermudanBhutaneseBlackfeetBolivianBrazilianBritishBritish West IndianBulgarianBurmeseCajunCambodianCanadianCape VerdeanCarpatho RusynCelticCentral AmericanCentral American IndianCherokeeCheyenneChickasawChileanChineseChippewaChoctawColombianColvilleComancheCosta RicanCreeCreekCroatianCrowCubanCypriotCzechCzechoslovakianDanishDelawareDominicanDutchDutch West IndianEastern EuropeanEcuadorianEgyptianEnglishEstonianEthiopianEuropeanFijianFilipinoFinnishFrenchFrench American IndianFrench CanadianGermanGerman RussianGhanaianGreekGuamanian/ChamorroGuatemalanGuyaneseHaitianHmongHonduranHopiHoumaHungarianIcelanderIndian (Asian)IndonesianInupiatIranianIraqiIrishIroquoisIsraeliItalianJamaicanJapaneseJordanianKenyanKiowaKoreanLaotianLatvianLebaneseLiberianLithuanianLumbeeLuxembourgerMacedonianMalaysianMalteseMarshalleseMenomineeMexicanMexican American IndianMongolianMoroccanNative HawaiianNavajoNepaleseNew ZealanderNicaraguanNigerianNorthern EuropeanNorwegianOkinawanOsageOttawaPaiutePakistaniPalestinianPanamanianParaguayanPennsylvania GermanPeruvianPimaPolishPortuguesePotawatomiPuebloPuerto RicanPuget Sound SalishRomanianRussianSalvadoranSamoanScandinavianScotch-IrishScottishSeminoleSenegaleseSerbianShoshoneSierra LeoneanSiouxSlavicSlovakSloveneSomaliSouth AfricanSouth AmericanSouth American IndianSoviet UnionSpaniardSpanishSpanish AmericanSpanish American IndianSri LankanSubsaharan AfricanSudaneseSwedishSwissSyrianTaiwaneseThaiTlingit-HaidaTohono O'OdhamTonganTrinidadian and TobagonianTsimshianTurkishU.S. Virgin IslanderUgandanUkrainianUruguayanUteVenezuelanVietnameseWelshWest IndianYakamaYaquiYugoslavianYumanYup'ikZimbabwean
Immigration
NonimmigrantsImmigrantsAfghanistanAfricaAlbaniaArgentinaArmeniaAsiaAustraliaAustriaBahamasBangladeshBarbadosBelarusBelgiumBelizeBoliviaBosnia and HerzegovinaBrazilBulgariaBurma/MyanmarCabo VerdeCambodiaCameroonCanadaCaribbeanCentral AmericaChileChinaColombiaCongoCosta RicaCroatiaCubaCzechoslovakiaDenmarkDominicaDominican RepublicEastern AfricaEastern AsiaEastern EuropeEcuadorEgyptEl SalvadorEnglandEritreaEthiopiaEuropeFijiFranceGermanyGhanaGreeceGrenadaGuatemalaGuyanaHaitiHondurasHong KongHungaryIndiaIndonesiaIranIraqIrelandIsraelItalyJamaicaJapanJordanKazakhstanKenyaKoreaKuwaitLaosLatin AmericaLatviaLebanonLiberiaLithuaniaMalaysiaMexicoMicronesiaMiddle AfricaMoldovaMoroccoNepalNetherlandsNicaraguaNigeriaNorth AmericaNorth MacedoniaNorthern AfricaNorthern EuropeNorwayOceaniaPakistanPanamaPeruPhilippinesPolandPortugalRomaniaRussiaSaudi ArabiaScotlandSenegalSerbiaSierra LeoneSingaporeSomaliaSouth AfricaSouth AmericaSouth Central AsiaSouth Eastern AsiaSouthern EuropeSpainSri LankaSt. Vincent and the GrenadinesSudanSwedenSwitzerlandSyriaTaiwanThailandTrinidad and TobagoTurkeyUgandaUruguayUzbekistanVenezuelaVietnamWest IndiesWestern AfricaWestern AsiaWestern EuropeYemenZaireZimbabweAzores
Family Households
Income
Poverty
Unemployment
Labor Participation
Family Structure
Vehicle Availability
Education Level
Disability

Family Households Comparison

Immigrants from Ukraine

Immigrants from Israel

Fair
Tragic
64.2%
FAMILY HOUSEHOLDS
38.2/ 100
METRIC RATING
179th/ 347
METRIC RANK
63.4%
FAMILY HOUSEHOLDS
1.8/ 100
METRIC RATING
242nd/ 347
METRIC RANK

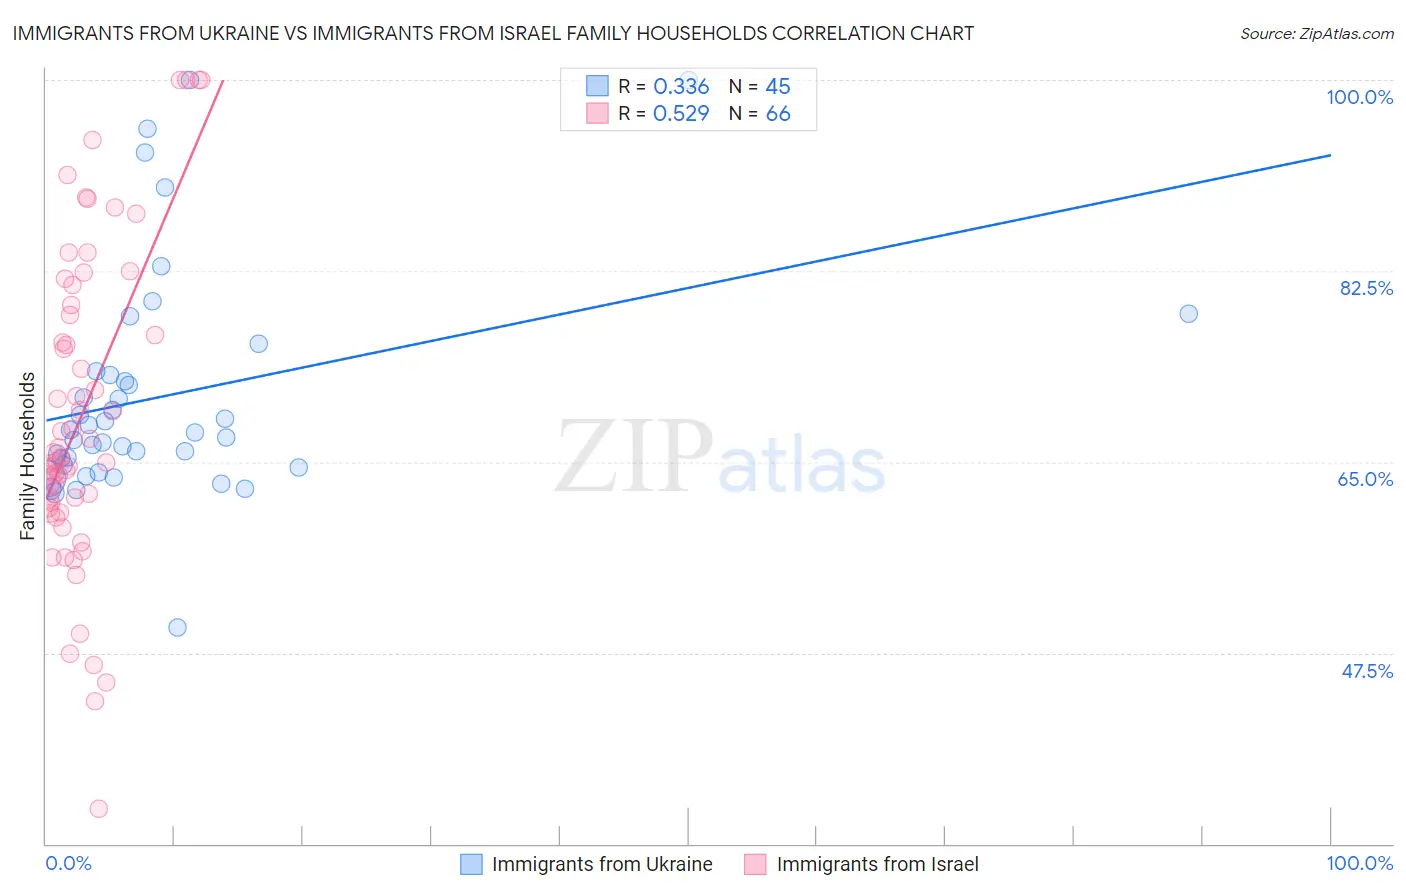
Immigrants from Ukraine vs Immigrants from Israel Family Households Correlation Chart

The statistical analysis conducted on geographies consisting of 289,649,929 people shows a mild positive correlation between the proportion of Immigrants from Ukraine and percentage of family households in the United States with a correlation coefficient (R) of 0.336 and weighted average of 64.2%. Similarly, the statistical analysis conducted on geographies consisting of 209,979,754 people shows a substantial positive correlation between the proportion of Immigrants from Israel and percentage of family households in the United States with a correlation coefficient (R) of 0.529 and weighted average of 63.4%, a difference of 1.2%.
Immigrants from Ukraine vs Immigrants from Israel Family Households

Family Households Correlation Summary

MeasurementImmigrants from UkraineImmigrants from Israel
Minimum49.9%33.2%
Maximum100.0%100.0%
Range50.1%66.8%
Mean71.0%69.4%
Median67.7%65.6%
Interquartile 25% (IQ1)64.6%60.8%
Interquartile 75% (IQ3)73.1%79.4%
Interquartile Range (IQR)8.5%18.6%
Standard Deviation (Sample)10.5%14.6%
Standard Deviation (Population)10.4%14.5%

Similar Demographics by Family Households

Demographics Similar to Immigrants from Ukraine by Family Households

In terms of family households, the demographic groups most similar to Immigrants from Ukraine are Jamaican (64.2%, a difference of 0.030%), Immigrants from Honduras (64.2%, a difference of 0.050%), Immigrants from Trinidad and Tobago (64.2%, a difference of 0.050%), Ukrainian (64.2%, a difference of 0.050%), and Immigrants from Micronesia (64.2%, a difference of 0.060%).
DemographicsRating | RankFamily Households
Dutch West Indians
53.9
/100
|
#172
Average
64.3%
Immigrants | Sierra Leone
52.5
/100
|
#173
Average
64.3%
Immigrants | Germany
50.0
/100
|
#174
Average
64.3%
Bangladeshis
44.3
/100
|
#175
Average
64.3%
Vietnamese
43.6
/100
|
#176
Average
64.2%
Immigrants | Micronesia
42.3
/100
|
#177
Average
64.2%
Jamaicans
40.6
/100
|
#178
Average
64.2%
Immigrants | Ukraine
38.2
/100
|
#179
Fair
64.2%
Immigrants | Honduras
35.0
/100
|
#180
Fair
64.2%
Immigrants | Trinidad and Tobago
34.9
/100
|
#181
Fair
64.2%
Ukrainians
34.6
/100
|
#182
Fair
64.2%
Creek
34.1
/100
|
#183
Fair
64.2%
Puerto Ricans
33.4
/100
|
#184
Fair
64.2%
Immigrants | Iran
30.4
/100
|
#185
Fair
64.1%
Spanish Americans
30.1
/100
|
#186
Fair
64.1%

Demographics Similar to Immigrants from Israel by Family Households

In terms of family households, the demographic groups most similar to Immigrants from Israel are Aleut (63.4%, a difference of 0.010%), South African (63.4%, a difference of 0.010%), Immigrants from St. Vincent and the Grenadines (63.4%, a difference of 0.010%), Immigrants from Czechoslovakia (63.4%, a difference of 0.010%), and Immigrants from Zimbabwe (63.5%, a difference of 0.040%).
DemographicsRating | RankFamily Households
Albanians
2.2
/100
|
#235
Tragic
63.5%
Ghanaians
2.1
/100
|
#236
Tragic
63.5%
Comanche
2.1
/100
|
#237
Tragic
63.5%
Immigrants | Zimbabwe
2.0
/100
|
#238
Tragic
63.5%
Aleuts
1.9
/100
|
#239
Tragic
63.4%
South Africans
1.9
/100
|
#240
Tragic
63.4%
Immigrants | St. Vincent and the Grenadines
1.9
/100
|
#241
Tragic
63.4%
Immigrants | Israel
1.8
/100
|
#242
Tragic
63.4%
Immigrants | Czechoslovakia
1.8
/100
|
#243
Tragic
63.4%
Eastern Europeans
1.6
/100
|
#244
Tragic
63.4%
Immigrants | Dominica
1.6
/100
|
#245
Tragic
63.4%
Immigrants | Ghana
1.6
/100
|
#246
Tragic
63.4%
Immigrants | Uzbekistan
1.5
/100
|
#247
Tragic
63.4%
Dominicans
1.5
/100
|
#248
Tragic
63.4%
Russians
1.4
/100
|
#249
Tragic
63.4%