Immigrants from Southern Europe vs Immigrants from Israel Family Households
COMPARE
Immigrants from Southern Europe
Immigrants from Israel
Family Households
Family Households Comparison
Immigrants from Southern Europe
Immigrants from Israel
64.4%
FAMILY HOUSEHOLDS
60.0/ 100
METRIC RATING
165th/ 347
METRIC RANK
63.4%
FAMILY HOUSEHOLDS
1.8/ 100
METRIC RATING
242nd/ 347
METRIC RANK
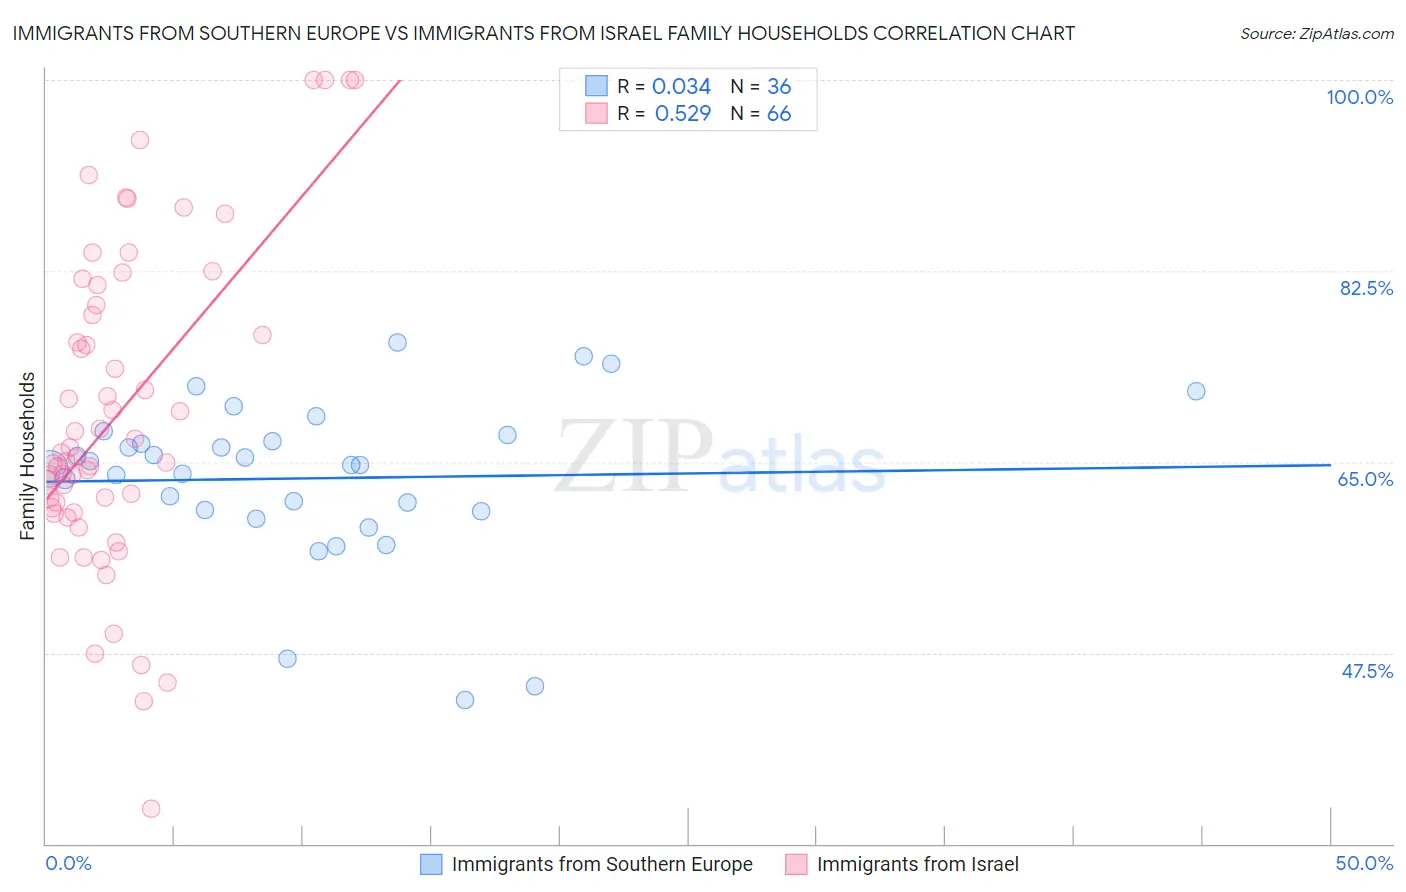
Immigrants from Southern Europe vs Immigrants from Israel Family Households Correlation Chart
The statistical analysis conducted on geographies consisting of 402,628,805 people shows no correlation between the proportion of Immigrants from Southern Europe and percentage of family households in the United States with a correlation coefficient (R) of 0.034 and weighted average of 64.4%. Similarly, the statistical analysis conducted on geographies consisting of 209,979,754 people shows a substantial positive correlation between the proportion of Immigrants from Israel and percentage of family households in the United States with a correlation coefficient (R) of 0.529 and weighted average of 63.4%, a difference of 1.5%.
Family Households Correlation Summary
| Measurement | Immigrants from Southern Europe | Immigrants from Israel |
| Minimum | 43.1% | 33.2% |
| Maximum | 76.0% | 100.0% |
| Range | 32.9% | 66.8% |
| Mean | 63.5% | 69.4% |
| Median | 64.7% | 65.6% |
| Interquartile 25% (IQ1) | 60.5% | 60.8% |
| Interquartile 75% (IQ3) | 67.2% | 79.4% |
| Interquartile Range (IQR) | 6.7% | 18.6% |
| Standard Deviation (Sample) | 7.4% | 14.6% |
| Standard Deviation (Population) | 7.3% | 14.5% |
Similar Demographics by Family Households
Demographics Similar to Immigrants from Southern Europe by Family Households
In terms of family households, the demographic groups most similar to Immigrants from Southern Europe are Immigrants from Nigeria (64.4%, a difference of 0.0%), Scotch-Irish (64.4%, a difference of 0.010%), British (64.4%, a difference of 0.020%), Chickasaw (64.4%, a difference of 0.020%), and Irish (64.4%, a difference of 0.030%).
| Demographics | Rating | Rank | Family Households |
| Lebanese | 66.4 /100 | #158 | Good 64.4% |
| Germans | 65.8 /100 | #159 | Good 64.4% |
| Immigrants | Moldova | 65.2 /100 | #160 | Good 64.4% |
| Immigrants | England | 62.6 /100 | #161 | Good 64.4% |
| British | 61.6 /100 | #162 | Good 64.4% |
| Chickasaw | 61.5 /100 | #163 | Good 64.4% |
| Immigrants | Nigeria | 60.1 /100 | #164 | Good 64.4% |
| Immigrants | Southern Europe | 60.0 /100 | #165 | Good 64.4% |
| Scotch-Irish | 59.2 /100 | #166 | Average 64.4% |
| Irish | 57.9 /100 | #167 | Average 64.4% |
| Hondurans | 57.5 /100 | #168 | Average 64.4% |
| Iraqis | 56.0 /100 | #169 | Average 64.4% |
| Armenians | 55.9 /100 | #170 | Average 64.4% |
| Ute | 54.6 /100 | #171 | Average 64.3% |
| Dutch West Indians | 53.9 /100 | #172 | Average 64.3% |
Demographics Similar to Immigrants from Israel by Family Households
In terms of family households, the demographic groups most similar to Immigrants from Israel are Aleut (63.4%, a difference of 0.010%), South African (63.4%, a difference of 0.010%), Immigrants from St. Vincent and the Grenadines (63.4%, a difference of 0.010%), Immigrants from Czechoslovakia (63.4%, a difference of 0.010%), and Immigrants from Zimbabwe (63.5%, a difference of 0.040%).
| Demographics | Rating | Rank | Family Households |
| Albanians | 2.2 /100 | #235 | Tragic 63.5% |
| Ghanaians | 2.1 /100 | #236 | Tragic 63.5% |
| Comanche | 2.1 /100 | #237 | Tragic 63.5% |
| Immigrants | Zimbabwe | 2.0 /100 | #238 | Tragic 63.5% |
| Aleuts | 1.9 /100 | #239 | Tragic 63.4% |
| South Africans | 1.9 /100 | #240 | Tragic 63.4% |
| Immigrants | St. Vincent and the Grenadines | 1.9 /100 | #241 | Tragic 63.4% |
| Immigrants | Israel | 1.8 /100 | #242 | Tragic 63.4% |
| Immigrants | Czechoslovakia | 1.8 /100 | #243 | Tragic 63.4% |
| Eastern Europeans | 1.6 /100 | #244 | Tragic 63.4% |
| Immigrants | Dominica | 1.6 /100 | #245 | Tragic 63.4% |
| Immigrants | Ghana | 1.6 /100 | #246 | Tragic 63.4% |
| Immigrants | Uzbekistan | 1.5 /100 | #247 | Tragic 63.4% |
| Dominicans | 1.5 /100 | #248 | Tragic 63.4% |
| Russians | 1.4 /100 | #249 | Tragic 63.4% |