Immigrants from Belarus vs Immigrants from Israel Family Households
COMPARE
Immigrants from Belarus
Immigrants from Israel
Family Households
Family Households Comparison
Immigrants from Belarus
Immigrants from Israel
63.7%
FAMILY HOUSEHOLDS
5.5/ 100
METRIC RATING
222nd/ 347
METRIC RANK
63.4%
FAMILY HOUSEHOLDS
1.8/ 100
METRIC RATING
242nd/ 347
METRIC RANK
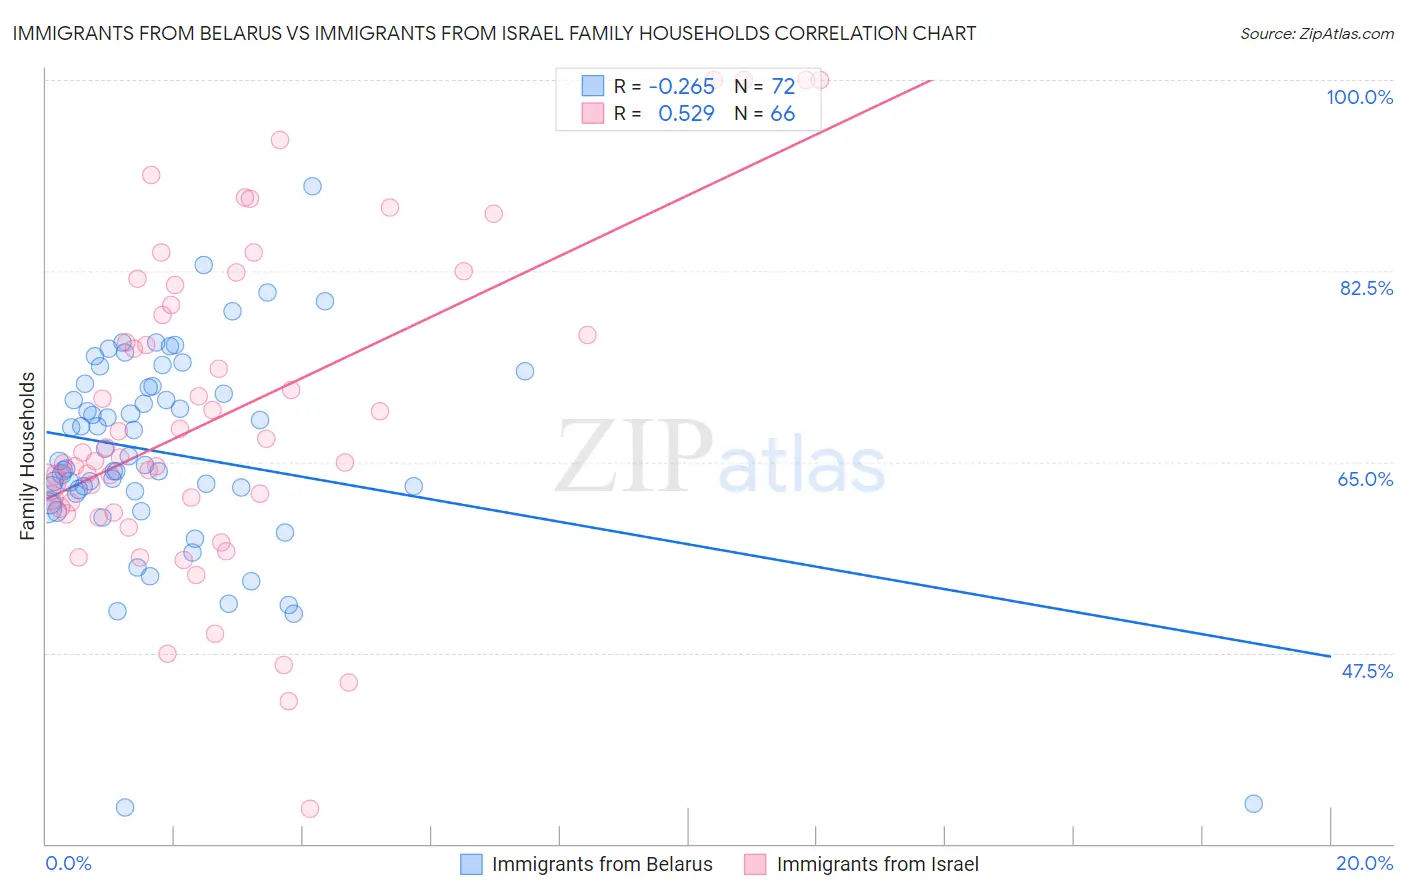
Immigrants from Belarus vs Immigrants from Israel Family Households Correlation Chart
The statistical analysis conducted on geographies consisting of 150,177,512 people shows a weak negative correlation between the proportion of Immigrants from Belarus and percentage of family households in the United States with a correlation coefficient (R) of -0.265 and weighted average of 63.7%. Similarly, the statistical analysis conducted on geographies consisting of 209,979,754 people shows a substantial positive correlation between the proportion of Immigrants from Israel and percentage of family households in the United States with a correlation coefficient (R) of 0.529 and weighted average of 63.4%, a difference of 0.39%.
Family Households Correlation Summary
| Measurement | Immigrants from Belarus | Immigrants from Israel |
| Minimum | 33.4% | 33.2% |
| Maximum | 90.2% | 100.0% |
| Range | 56.9% | 66.8% |
| Mean | 65.8% | 69.4% |
| Median | 64.9% | 65.6% |
| Interquartile 25% (IQ1) | 62.2% | 60.8% |
| Interquartile 75% (IQ3) | 71.9% | 79.4% |
| Interquartile Range (IQR) | 9.7% | 18.6% |
| Standard Deviation (Sample) | 9.5% | 14.6% |
| Standard Deviation (Population) | 9.4% | 14.5% |
Demographics Similar to Immigrants from Belarus and Immigrants from Israel by Family Households
In terms of family households, the demographic groups most similar to Immigrants from Belarus are French Canadian (63.7%, a difference of 0.010%), Turkish (63.6%, a difference of 0.070%), Immigrants from Hungary (63.6%, a difference of 0.090%), Immigrants from Bahamas (63.6%, a difference of 0.10%), and Trinidadian and Tobagonian (63.6%, a difference of 0.10%). Similarly, the demographic groups most similar to Immigrants from Israel are Aleut (63.4%, a difference of 0.010%), South African (63.4%, a difference of 0.010%), Immigrants from St. Vincent and the Grenadines (63.4%, a difference of 0.010%), Immigrants from Zimbabwe (63.5%, a difference of 0.040%), and Ghanaian (63.5%, a difference of 0.050%).
| Demographics | Rating | Rank | Family Households |
| Immigrants | Belarus | 5.5 /100 | #222 | Tragic 63.7% |
| French Canadians | 5.4 /100 | #223 | Tragic 63.7% |
| Turks | 4.5 /100 | #224 | Tragic 63.6% |
| Immigrants | Hungary | 4.3 /100 | #225 | Tragic 63.6% |
| Immigrants | Bahamas | 4.2 /100 | #226 | Tragic 63.6% |
| Trinidadians and Tobagonians | 4.1 /100 | #227 | Tragic 63.6% |
| Blackfeet | 3.6 /100 | #228 | Tragic 63.6% |
| Bulgarians | 3.4 /100 | #229 | Tragic 63.6% |
| Immigrants | Brazil | 3.0 /100 | #230 | Tragic 63.6% |
| Immigrants | Greece | 2.9 /100 | #231 | Tragic 63.5% |
| Immigrants | Northern Africa | 2.6 /100 | #232 | Tragic 63.5% |
| Immigrants | Armenia | 2.6 /100 | #233 | Tragic 63.5% |
| Finns | 2.3 /100 | #234 | Tragic 63.5% |
| Albanians | 2.2 /100 | #235 | Tragic 63.5% |
| Ghanaians | 2.1 /100 | #236 | Tragic 63.5% |
| Comanche | 2.1 /100 | #237 | Tragic 63.5% |
| Immigrants | Zimbabwe | 2.0 /100 | #238 | Tragic 63.5% |
| Aleuts | 1.9 /100 | #239 | Tragic 63.4% |
| South Africans | 1.9 /100 | #240 | Tragic 63.4% |
| Immigrants | St. Vincent and the Grenadines | 1.9 /100 | #241 | Tragic 63.4% |
| Immigrants | Israel | 1.8 /100 | #242 | Tragic 63.4% |