Alaskan Athabascan vs Guyanese Married-couple Households
COMPARE
Alaskan Athabascan
Guyanese
Married-couple Households
Married-couple Households Comparison
Alaskan Athabascans
Guyanese
43.6%
MARRIED-COUPLE HOUSEHOLDS
0.2/ 100
METRIC RATING
261st/ 347
METRIC RANK
41.4%
MARRIED-COUPLE HOUSEHOLDS
0.0/ 100
METRIC RATING
306th/ 347
METRIC RANK
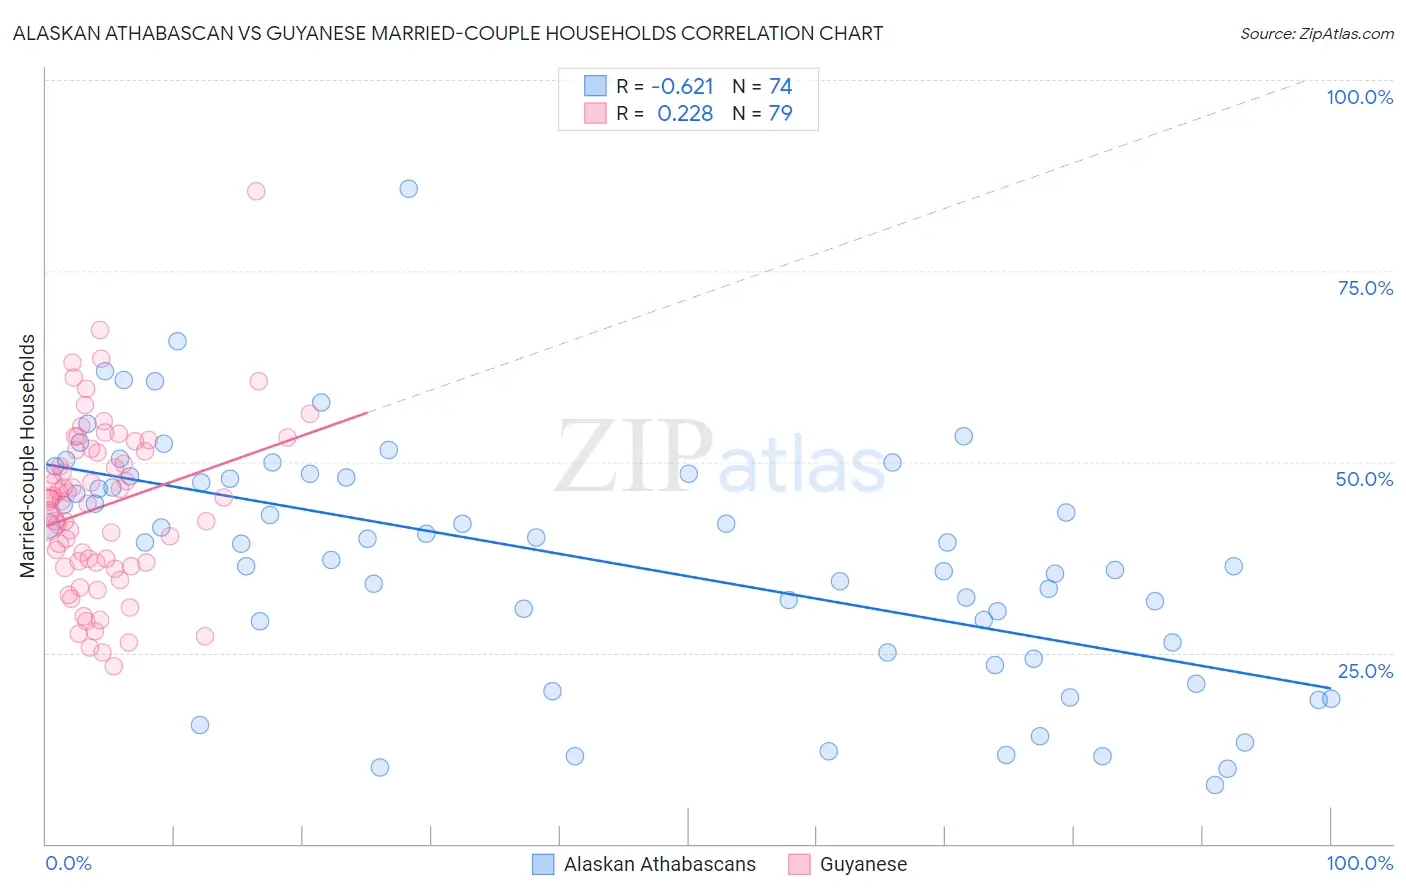
Alaskan Athabascan vs Guyanese Married-couple Households Correlation Chart
The statistical analysis conducted on geographies consisting of 45,814,810 people shows a significant negative correlation between the proportion of Alaskan Athabascans and percentage of married-couple family households in the United States with a correlation coefficient (R) of -0.621 and weighted average of 43.6%. Similarly, the statistical analysis conducted on geographies consisting of 176,795,479 people shows a weak positive correlation between the proportion of Guyanese and percentage of married-couple family households in the United States with a correlation coefficient (R) of 0.228 and weighted average of 41.4%, a difference of 5.5%.
Married-couple Households Correlation Summary
| Measurement | Alaskan Athabascan | Guyanese |
| Minimum | 7.7% | 23.3% |
| Maximum | 85.7% | 85.4% |
| Range | 78.0% | 62.2% |
| Mean | 37.3% | 44.2% |
| Median | 39.4% | 45.0% |
| Interquartile 25% (IQ1) | 26.4% | 36.8% |
| Interquartile 75% (IQ3) | 48.1% | 51.5% |
| Interquartile Range (IQR) | 21.7% | 14.7% |
| Standard Deviation (Sample) | 15.6% | 11.1% |
| Standard Deviation (Population) | 15.5% | 11.0% |
Similar Demographics by Married-couple Households
Demographics Similar to Alaskan Athabascans by Married-couple Households
In terms of married-couple households, the demographic groups most similar to Alaskan Athabascans are Vietnamese (43.6%, a difference of 0.060%), Immigrants from Cameroon (43.7%, a difference of 0.13%), Cree (43.6%, a difference of 0.17%), Iroquois (43.7%, a difference of 0.22%), and Central American Indian (43.8%, a difference of 0.25%).
| Demographics | Rating | Rank | Married-couple Households |
| Apache | 0.3 /100 | #254 | Tragic 43.9% |
| Shoshone | 0.3 /100 | #255 | Tragic 43.9% |
| Ugandans | 0.3 /100 | #256 | Tragic 43.8% |
| Blackfeet | 0.2 /100 | #257 | Tragic 43.8% |
| Central American Indians | 0.2 /100 | #258 | Tragic 43.8% |
| Iroquois | 0.2 /100 | #259 | Tragic 43.7% |
| Immigrants | Cameroon | 0.2 /100 | #260 | Tragic 43.7% |
| Alaskan Athabascans | 0.2 /100 | #261 | Tragic 43.6% |
| Vietnamese | 0.2 /100 | #262 | Tragic 43.6% |
| Cree | 0.1 /100 | #263 | Tragic 43.6% |
| Bangladeshis | 0.1 /100 | #264 | Tragic 43.5% |
| Moroccans | 0.1 /100 | #265 | Tragic 43.5% |
| Ecuadorians | 0.1 /100 | #266 | Tragic 43.5% |
| Natives/Alaskans | 0.1 /100 | #267 | Tragic 43.5% |
| Immigrants | Burma/Myanmar | 0.1 /100 | #268 | Tragic 43.4% |
Demographics Similar to Guyanese by Married-couple Households
In terms of married-couple households, the demographic groups most similar to Guyanese are Immigrants from Western Africa (41.4%, a difference of 0.010%), Crow (41.4%, a difference of 0.010%), Immigrants from Trinidad and Tobago (41.2%, a difference of 0.36%), Sioux (41.5%, a difference of 0.37%), and Haitian (41.2%, a difference of 0.44%).
| Demographics | Rating | Rank | Married-couple Households |
| Immigrants | Ghana | 0.0 /100 | #299 | Tragic 41.8% |
| Immigrants | Belize | 0.0 /100 | #300 | Tragic 41.8% |
| Immigrants | Bahamas | 0.0 /100 | #301 | Tragic 41.7% |
| Immigrants | Honduras | 0.0 /100 | #302 | Tragic 41.6% |
| Sub-Saharan Africans | 0.0 /100 | #303 | Tragic 41.6% |
| Immigrants | Guyana | 0.0 /100 | #304 | Tragic 41.6% |
| Sioux | 0.0 /100 | #305 | Tragic 41.5% |
| Guyanese | 0.0 /100 | #306 | Tragic 41.4% |
| Immigrants | Western Africa | 0.0 /100 | #307 | Tragic 41.4% |
| Crow | 0.0 /100 | #308 | Tragic 41.4% |
| Immigrants | Trinidad and Tobago | 0.0 /100 | #309 | Tragic 41.2% |
| Haitians | 0.0 /100 | #310 | Tragic 41.2% |
| Colville | 0.0 /100 | #311 | Tragic 41.0% |
| Africans | 0.0 /100 | #312 | Tragic 40.9% |
| Immigrants | Haiti | 0.0 /100 | #313 | Tragic 40.9% |