Alaskan Athabascan vs Guyanese Average Family Size
COMPARE
Alaskan Athabascan
Guyanese
Average Family Size
Average Family Size Comparison
Alaskan Athabascans
Guyanese
3.27
AVERAGE FAMILY SIZE
92.4/ 100
METRIC RATING
123rd/ 347
METRIC RANK
3.40
AVERAGE FAMILY SIZE
100.0/ 100
METRIC RATING
37th/ 347
METRIC RANK
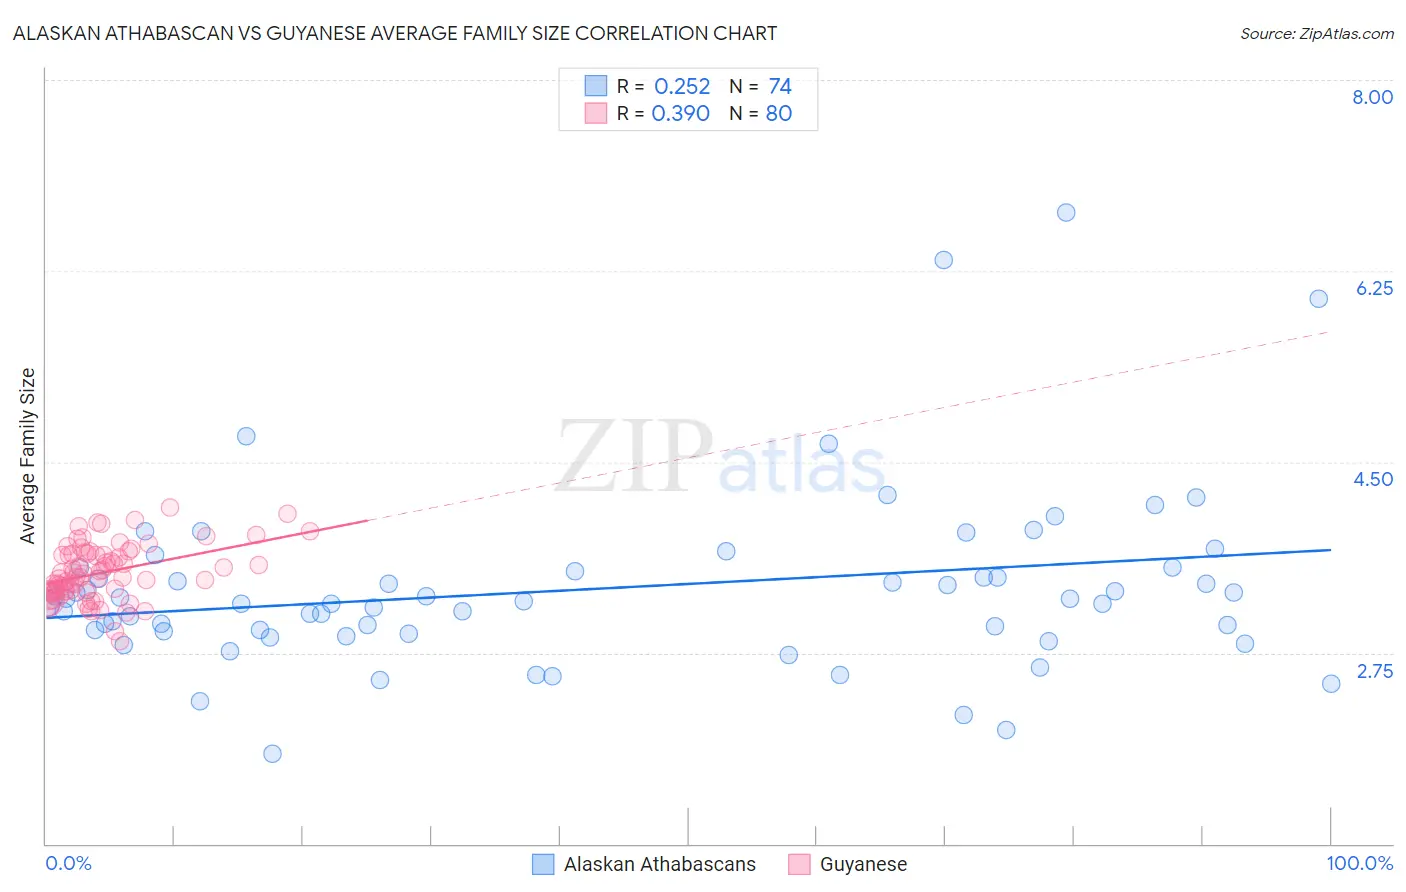
Alaskan Athabascan vs Guyanese Average Family Size Correlation Chart
The statistical analysis conducted on geographies consisting of 45,814,644 people shows a weak positive correlation between the proportion of Alaskan Athabascans and average family size in the United States with a correlation coefficient (R) of 0.252 and weighted average of 3.27. Similarly, the statistical analysis conducted on geographies consisting of 176,801,738 people shows a mild positive correlation between the proportion of Guyanese and average family size in the United States with a correlation coefficient (R) of 0.390 and weighted average of 3.40, a difference of 4.1%.
Average Family Size Correlation Summary
| Measurement | Alaskan Athabascan | Guyanese |
| Minimum | 1.83 | 2.86 |
| Maximum | 6.79 | 4.08 |
| Range | 4.96 | 1.22 |
| Mean | 3.34 | 3.49 |
| Median | 3.21 | 3.46 |
| Interquartile 25% (IQ1) | 2.95 | 3.31 |
| Interquartile 75% (IQ3) | 3.50 | 3.65 |
| Interquartile Range (IQR) | 0.55 | 0.34 |
| Standard Deviation (Sample) | 0.82 | 0.25 |
| Standard Deviation (Population) | 0.82 | 0.25 |
Similar Demographics by Average Family Size
Demographics Similar to Alaskan Athabascans by Average Family Size
In terms of average family size, the demographic groups most similar to Alaskan Athabascans are Immigrants from Colombia (3.27, a difference of 0.020%), South American Indian (3.26, a difference of 0.050%), Immigrants from Thailand (3.27, a difference of 0.060%), Immigrants from Cuba (3.26, a difference of 0.070%), and Immigrants from Bahamas (3.27, a difference of 0.080%).
| Demographics | Rating | Rank | Average Family Size |
| Immigrants | South America | 95.0 /100 | #116 | Exceptional 3.27 |
| Kiowa | 94.8 /100 | #117 | Exceptional 3.27 |
| Immigrants | Asia | 94.0 /100 | #118 | Exceptional 3.27 |
| Immigrants | Indonesia | 93.7 /100 | #119 | Exceptional 3.27 |
| Immigrants | Bahamas | 93.6 /100 | #120 | Exceptional 3.27 |
| Immigrants | Thailand | 93.3 /100 | #121 | Exceptional 3.27 |
| Immigrants | Colombia | 92.8 /100 | #122 | Exceptional 3.27 |
| Alaskan Athabascans | 92.4 /100 | #123 | Exceptional 3.27 |
| South American Indians | 91.6 /100 | #124 | Exceptional 3.26 |
| Immigrants | Cuba | 91.3 /100 | #125 | Exceptional 3.26 |
| Immigrants | Costa Rica | 90.7 /100 | #126 | Exceptional 3.26 |
| Immigrants | Syria | 90.6 /100 | #127 | Exceptional 3.26 |
| Colombians | 89.9 /100 | #128 | Excellent 3.26 |
| Immigrants | Hong Kong | 88.6 /100 | #129 | Excellent 3.26 |
| Laotians | 88.5 /100 | #130 | Excellent 3.26 |
Demographics Similar to Guyanese by Average Family Size
In terms of average family size, the demographic groups most similar to Guyanese are Immigrants from Guyana (3.40, a difference of 0.14%), Immigrants from Belize (3.39, a difference of 0.16%), Guatemalan (3.40, a difference of 0.19%), Immigrants from Haiti (3.39, a difference of 0.24%), and Hispanic or Latino (3.41, a difference of 0.25%).
| Demographics | Rating | Rank | Average Family Size |
| Samoans | 100.0 /100 | #30 | Exceptional 3.42 |
| Central Americans | 100.0 /100 | #31 | Exceptional 3.41 |
| Immigrants | Guatemala | 100.0 /100 | #32 | Exceptional 3.41 |
| Hawaiians | 100.0 /100 | #33 | Exceptional 3.41 |
| Hispanics or Latinos | 100.0 /100 | #34 | Exceptional 3.41 |
| Guatemalans | 100.0 /100 | #35 | Exceptional 3.40 |
| Immigrants | Guyana | 100.0 /100 | #36 | Exceptional 3.40 |
| Guyanese | 100.0 /100 | #37 | Exceptional 3.40 |
| Immigrants | Belize | 100.0 /100 | #38 | Exceptional 3.39 |
| Immigrants | Haiti | 100.0 /100 | #39 | Exceptional 3.39 |
| Belizeans | 100.0 /100 | #40 | Exceptional 3.39 |
| Marshallese | 100.0 /100 | #41 | Exceptional 3.38 |
| Immigrants | Vietnam | 100.0 /100 | #42 | Exceptional 3.38 |
| Immigrants | Philippines | 100.0 /100 | #43 | Exceptional 3.37 |
| Alaska Natives | 100.0 /100 | #44 | Exceptional 3.37 |