Alaskan Athabascan vs Irish Married-couple Households
COMPARE
Alaskan Athabascan
Irish
Married-couple Households
Married-couple Households Comparison
Alaskan Athabascans
Irish
43.6%
MARRIED-COUPLE HOUSEHOLDS
0.2/ 100
METRIC RATING
261st/ 347
METRIC RANK
48.6%
MARRIED-COUPLE HOUSEHOLDS
99.3/ 100
METRIC RATING
52nd/ 347
METRIC RANK
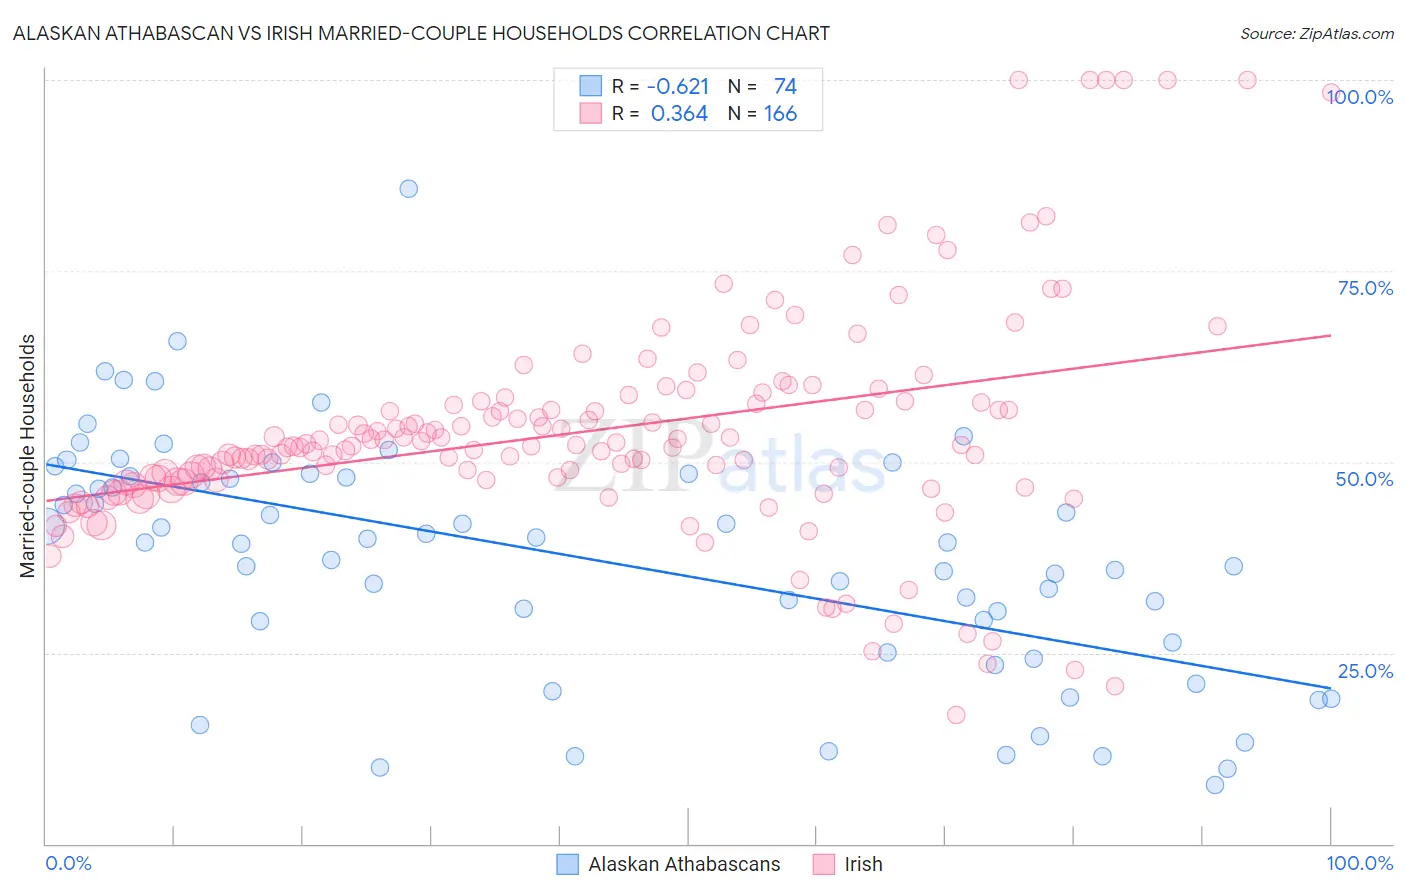
Alaskan Athabascan vs Irish Married-couple Households Correlation Chart
The statistical analysis conducted on geographies consisting of 45,814,810 people shows a significant negative correlation between the proportion of Alaskan Athabascans and percentage of married-couple family households in the United States with a correlation coefficient (R) of -0.621 and weighted average of 43.6%. Similarly, the statistical analysis conducted on geographies consisting of 579,966,528 people shows a mild positive correlation between the proportion of Irish and percentage of married-couple family households in the United States with a correlation coefficient (R) of 0.364 and weighted average of 48.6%, a difference of 11.4%.
Married-couple Households Correlation Summary
| Measurement | Alaskan Athabascan | Irish |
| Minimum | 7.7% | 16.8% |
| Maximum | 85.7% | 100.0% |
| Range | 78.0% | 83.2% |
| Mean | 37.3% | 54.0% |
| Median | 39.4% | 52.1% |
| Interquartile 25% (IQ1) | 26.4% | 47.4% |
| Interquartile 75% (IQ3) | 48.1% | 57.8% |
| Interquartile Range (IQR) | 21.7% | 10.4% |
| Standard Deviation (Sample) | 15.6% | 14.7% |
| Standard Deviation (Population) | 15.5% | 14.7% |
Similar Demographics by Married-couple Households
Demographics Similar to Alaskan Athabascans by Married-couple Households
In terms of married-couple households, the demographic groups most similar to Alaskan Athabascans are Vietnamese (43.6%, a difference of 0.060%), Immigrants from Cameroon (43.7%, a difference of 0.13%), Cree (43.6%, a difference of 0.17%), Iroquois (43.7%, a difference of 0.22%), and Central American Indian (43.8%, a difference of 0.25%).
| Demographics | Rating | Rank | Married-couple Households |
| Apache | 0.3 /100 | #254 | Tragic 43.9% |
| Shoshone | 0.3 /100 | #255 | Tragic 43.9% |
| Ugandans | 0.3 /100 | #256 | Tragic 43.8% |
| Blackfeet | 0.2 /100 | #257 | Tragic 43.8% |
| Central American Indians | 0.2 /100 | #258 | Tragic 43.8% |
| Iroquois | 0.2 /100 | #259 | Tragic 43.7% |
| Immigrants | Cameroon | 0.2 /100 | #260 | Tragic 43.7% |
| Alaskan Athabascans | 0.2 /100 | #261 | Tragic 43.6% |
| Vietnamese | 0.2 /100 | #262 | Tragic 43.6% |
| Cree | 0.1 /100 | #263 | Tragic 43.6% |
| Bangladeshis | 0.1 /100 | #264 | Tragic 43.5% |
| Moroccans | 0.1 /100 | #265 | Tragic 43.5% |
| Ecuadorians | 0.1 /100 | #266 | Tragic 43.5% |
| Natives/Alaskans | 0.1 /100 | #267 | Tragic 43.5% |
| Immigrants | Burma/Myanmar | 0.1 /100 | #268 | Tragic 43.4% |
Demographics Similar to Irish by Married-couple Households
In terms of married-couple households, the demographic groups most similar to Irish are Eastern European (48.6%, a difference of 0.040%), White/Caucasian (48.6%, a difference of 0.050%), Immigrants from Lithuania (48.6%, a difference of 0.060%), Austrian (48.6%, a difference of 0.060%), and Immigrants from Northern Europe (48.6%, a difference of 0.070%).
| Demographics | Rating | Rank | Married-couple Households |
| Immigrants | Eastern Asia | 99.5 /100 | #45 | Exceptional 48.8% |
| Tsimshian | 99.5 /100 | #46 | Exceptional 48.7% |
| British | 99.5 /100 | #47 | Exceptional 48.7% |
| Indians (Asian) | 99.4 /100 | #48 | Exceptional 48.7% |
| Immigrants | Sri Lanka | 99.4 /100 | #49 | Exceptional 48.7% |
| Samoans | 99.4 /100 | #50 | Exceptional 48.7% |
| Eastern Europeans | 99.3 /100 | #51 | Exceptional 48.6% |
| Irish | 99.3 /100 | #52 | Exceptional 48.6% |
| Whites/Caucasians | 99.3 /100 | #53 | Exceptional 48.6% |
| Immigrants | Lithuania | 99.3 /100 | #54 | Exceptional 48.6% |
| Austrians | 99.3 /100 | #55 | Exceptional 48.6% |
| Immigrants | Northern Europe | 99.3 /100 | #56 | Exceptional 48.6% |
| Poles | 99.2 /100 | #57 | Exceptional 48.5% |
| Immigrants | Indonesia | 99.2 /100 | #58 | Exceptional 48.5% |
| Czechoslovakians | 99.2 /100 | #59 | Exceptional 48.5% |