Ghanaian vs Guyanese Married-couple Households
COMPARE
Ghanaian
Guyanese
Married-couple Households
Married-couple Households Comparison
Ghanaians
Guyanese
42.2%
MARRIED-COUPLE HOUSEHOLDS
0.0/ 100
METRIC RATING
285th/ 347
METRIC RANK
41.4%
MARRIED-COUPLE HOUSEHOLDS
0.0/ 100
METRIC RATING
306th/ 347
METRIC RANK
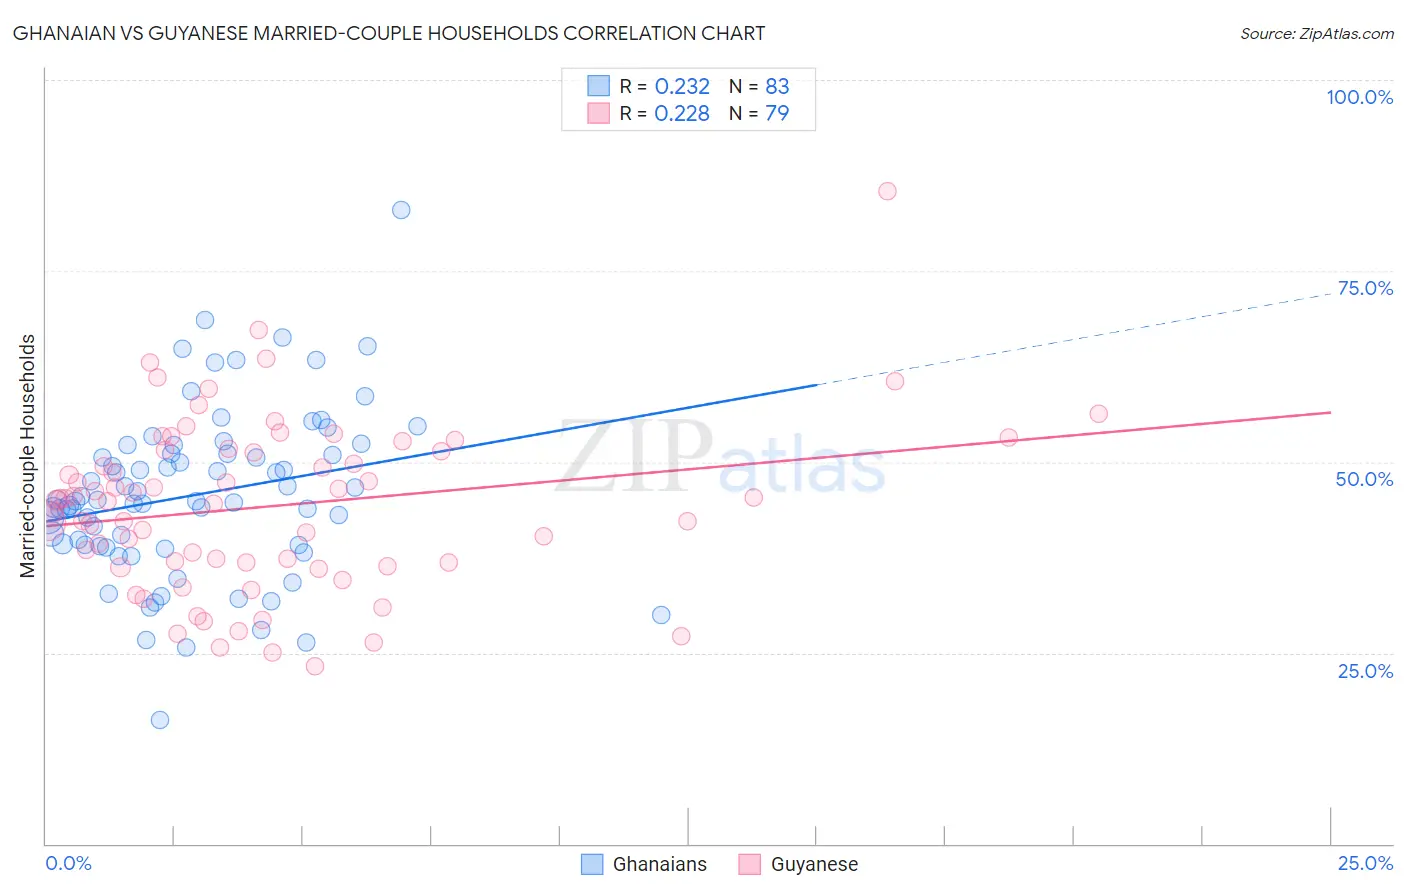
Ghanaian vs Guyanese Married-couple Households Correlation Chart
The statistical analysis conducted on geographies consisting of 190,506,796 people shows a weak positive correlation between the proportion of Ghanaians and percentage of married-couple family households in the United States with a correlation coefficient (R) of 0.232 and weighted average of 42.2%. Similarly, the statistical analysis conducted on geographies consisting of 176,795,479 people shows a weak positive correlation between the proportion of Guyanese and percentage of married-couple family households in the United States with a correlation coefficient (R) of 0.228 and weighted average of 41.4%, a difference of 2.1%.
Married-couple Households Correlation Summary
| Measurement | Ghanaian | Guyanese |
| Minimum | 16.2% | 23.3% |
| Maximum | 82.9% | 85.4% |
| Range | 66.7% | 62.2% |
| Mean | 45.7% | 44.2% |
| Median | 44.9% | 45.0% |
| Interquartile 25% (IQ1) | 39.1% | 36.8% |
| Interquartile 75% (IQ3) | 51.1% | 51.5% |
| Interquartile Range (IQR) | 12.0% | 14.7% |
| Standard Deviation (Sample) | 11.0% | 11.1% |
| Standard Deviation (Population) | 10.9% | 11.0% |
Similar Demographics by Married-couple Households
Demographics Similar to Ghanaians by Married-couple Households
In terms of married-couple households, the demographic groups most similar to Ghanaians are Belizean (42.2%, a difference of 0.010%), Cheyenne (42.3%, a difference of 0.030%), Chippewa (42.1%, a difference of 0.25%), Immigrants from Eritrea (42.1%, a difference of 0.33%), and Sudanese (42.1%, a difference of 0.38%).
| Demographics | Rating | Rank | Married-couple Households |
| Immigrants | Africa | 0.0 /100 | #278 | Tragic 42.9% |
| Sierra Leoneans | 0.0 /100 | #279 | Tragic 42.9% |
| Immigrants | Ecuador | 0.0 /100 | #280 | Tragic 42.9% |
| Immigrants | Guatemala | 0.0 /100 | #281 | Tragic 42.8% |
| Bermudans | 0.0 /100 | #282 | Tragic 42.4% |
| Inupiat | 0.0 /100 | #283 | Tragic 42.4% |
| Cheyenne | 0.0 /100 | #284 | Tragic 42.3% |
| Ghanaians | 0.0 /100 | #285 | Tragic 42.2% |
| Belizeans | 0.0 /100 | #286 | Tragic 42.2% |
| Chippewa | 0.0 /100 | #287 | Tragic 42.1% |
| Immigrants | Eritrea | 0.0 /100 | #288 | Tragic 42.1% |
| Sudanese | 0.0 /100 | #289 | Tragic 42.1% |
| Hondurans | 0.0 /100 | #290 | Tragic 42.1% |
| Paiute | 0.0 /100 | #291 | Tragic 42.1% |
| Indonesians | 0.0 /100 | #292 | Tragic 42.0% |
Demographics Similar to Guyanese by Married-couple Households
In terms of married-couple households, the demographic groups most similar to Guyanese are Immigrants from Western Africa (41.4%, a difference of 0.010%), Crow (41.4%, a difference of 0.010%), Immigrants from Trinidad and Tobago (41.2%, a difference of 0.36%), Sioux (41.5%, a difference of 0.37%), and Haitian (41.2%, a difference of 0.44%).
| Demographics | Rating | Rank | Married-couple Households |
| Immigrants | Ghana | 0.0 /100 | #299 | Tragic 41.8% |
| Immigrants | Belize | 0.0 /100 | #300 | Tragic 41.8% |
| Immigrants | Bahamas | 0.0 /100 | #301 | Tragic 41.7% |
| Immigrants | Honduras | 0.0 /100 | #302 | Tragic 41.6% |
| Sub-Saharan Africans | 0.0 /100 | #303 | Tragic 41.6% |
| Immigrants | Guyana | 0.0 /100 | #304 | Tragic 41.6% |
| Sioux | 0.0 /100 | #305 | Tragic 41.5% |
| Guyanese | 0.0 /100 | #306 | Tragic 41.4% |
| Immigrants | Western Africa | 0.0 /100 | #307 | Tragic 41.4% |
| Crow | 0.0 /100 | #308 | Tragic 41.4% |
| Immigrants | Trinidad and Tobago | 0.0 /100 | #309 | Tragic 41.2% |
| Haitians | 0.0 /100 | #310 | Tragic 41.2% |
| Colville | 0.0 /100 | #311 | Tragic 41.0% |
| Africans | 0.0 /100 | #312 | Tragic 40.9% |
| Immigrants | Haiti | 0.0 /100 | #313 | Tragic 40.9% |