African vs Sierra Leonean Currently Married
COMPARE
African
Sierra Leonean
Currently Married
Currently Married Comparison
Africans
Sierra Leoneans
41.8%
CURRENTLY MARRIED
0.0/ 100
METRIC RATING
307th/ 347
METRIC RANK
43.4%
CURRENTLY MARRIED
0.1/ 100
METRIC RATING
276th/ 347
METRIC RANK
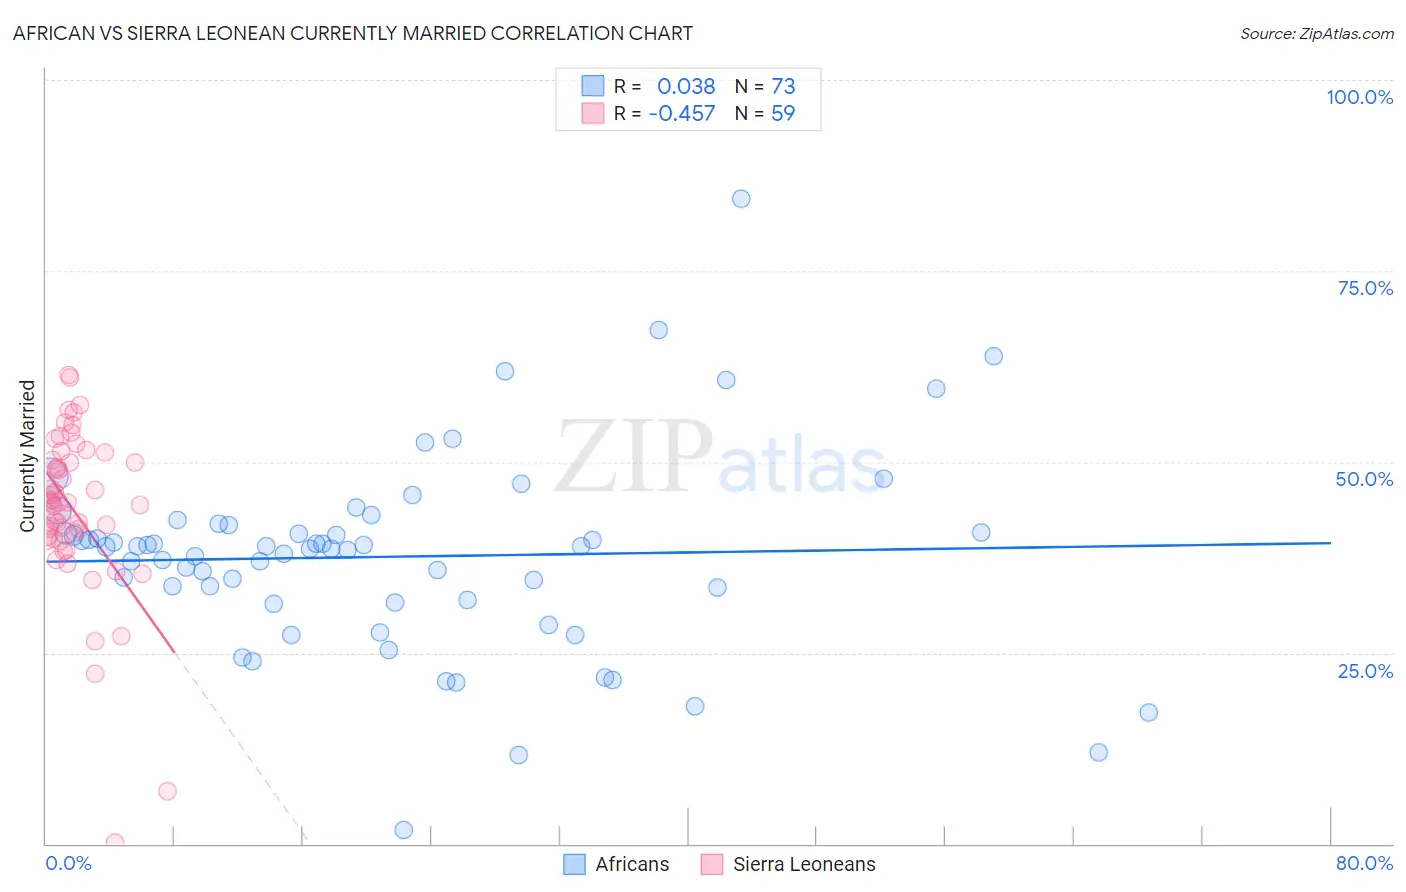
African vs Sierra Leonean Currently Married Correlation Chart
The statistical analysis conducted on geographies consisting of 470,023,481 people shows no correlation between the proportion of Africans and percentage of population currently married in the United States with a correlation coefficient (R) of 0.038 and weighted average of 41.8%. Similarly, the statistical analysis conducted on geographies consisting of 83,363,036 people shows a moderate negative correlation between the proportion of Sierra Leoneans and percentage of population currently married in the United States with a correlation coefficient (R) of -0.457 and weighted average of 43.4%, a difference of 3.8%.
Currently Married Correlation Summary
| Measurement | African | Sierra Leonean |
| Minimum | 1.8% | 0.10% |
| Maximum | 84.5% | 61.4% |
| Range | 82.7% | 61.3% |
| Mean | 37.6% | 43.6% |
| Median | 38.9% | 44.7% |
| Interquartile 25% (IQ1) | 31.7% | 39.9% |
| Interquartile 75% (IQ3) | 41.2% | 50.3% |
| Interquartile Range (IQR) | 9.4% | 10.4% |
| Standard Deviation (Sample) | 12.9% | 10.9% |
| Standard Deviation (Population) | 12.8% | 10.8% |
Similar Demographics by Currently Married
Demographics Similar to Africans by Currently Married
In terms of currently married, the demographic groups most similar to Africans are Immigrants from Belize (41.8%, a difference of 0.040%), Immigrants from Guyana (41.9%, a difference of 0.13%), Immigrants from Trinidad and Tobago (41.9%, a difference of 0.14%), Immigrants from Liberia (41.8%, a difference of 0.15%), and Immigrants from Bahamas (41.9%, a difference of 0.18%).
| Demographics | Rating | Rank | Currently Married |
| Belizeans | 0.0 /100 | #300 | Tragic 42.2% |
| Immigrants | Yemen | 0.0 /100 | #301 | Tragic 42.1% |
| Immigrants | Zaire | 0.0 /100 | #302 | Tragic 42.0% |
| Sioux | 0.0 /100 | #303 | Tragic 41.9% |
| Immigrants | Bahamas | 0.0 /100 | #304 | Tragic 41.9% |
| Immigrants | Trinidad and Tobago | 0.0 /100 | #305 | Tragic 41.9% |
| Immigrants | Guyana | 0.0 /100 | #306 | Tragic 41.9% |
| Africans | 0.0 /100 | #307 | Tragic 41.8% |
| Immigrants | Belize | 0.0 /100 | #308 | Tragic 41.8% |
| Immigrants | Liberia | 0.0 /100 | #309 | Tragic 41.8% |
| Guyanese | 0.0 /100 | #310 | Tragic 41.6% |
| Trinidadians and Tobagonians | 0.0 /100 | #311 | Tragic 41.5% |
| Somalis | 0.0 /100 | #312 | Tragic 41.5% |
| Jamaicans | 0.0 /100 | #313 | Tragic 41.4% |
| West Indians | 0.0 /100 | #314 | Tragic 41.3% |
Demographics Similar to Sierra Leoneans by Currently Married
In terms of currently married, the demographic groups most similar to Sierra Leoneans are Immigrants from Nigeria (43.4%, a difference of 0.010%), Colville (43.4%, a difference of 0.030%), Nigerian (43.4%, a difference of 0.050%), Yaqui (43.4%, a difference of 0.070%), and Indonesian (43.5%, a difference of 0.11%).
| Demographics | Rating | Rank | Currently Married |
| Immigrants | Sudan | 0.1 /100 | #269 | Tragic 43.5% |
| Salvadorans | 0.1 /100 | #270 | Tragic 43.5% |
| Bermudans | 0.1 /100 | #271 | Tragic 43.5% |
| Indonesians | 0.1 /100 | #272 | Tragic 43.5% |
| Yaqui | 0.1 /100 | #273 | Tragic 43.4% |
| Nigerians | 0.1 /100 | #274 | Tragic 43.4% |
| Colville | 0.1 /100 | #275 | Tragic 43.4% |
| Sierra Leoneans | 0.1 /100 | #276 | Tragic 43.4% |
| Immigrants | Nigeria | 0.1 /100 | #277 | Tragic 43.4% |
| Central Americans | 0.0 /100 | #278 | Tragic 43.3% |
| Central American Indians | 0.0 /100 | #279 | Tragic 43.3% |
| Apache | 0.0 /100 | #280 | Tragic 43.2% |
| Chippewa | 0.0 /100 | #281 | Tragic 43.2% |
| Immigrants | Ecuador | 0.0 /100 | #282 | Tragic 43.2% |
| Kiowa | 0.0 /100 | #283 | Tragic 43.2% |