African vs Sierra Leonean College, Under 1 year
COMPARE
African
Sierra Leonean
College, Under 1 year
College, Under 1 year Comparison
Africans
Sierra Leoneans
61.1%
COLLEGE, UNDER 1 YEAR
0.3/ 100
METRIC RATING
261st/ 347
METRIC RANK
66.0%
COLLEGE, UNDER 1 YEAR
67.8/ 100
METRIC RATING
157th/ 347
METRIC RANK
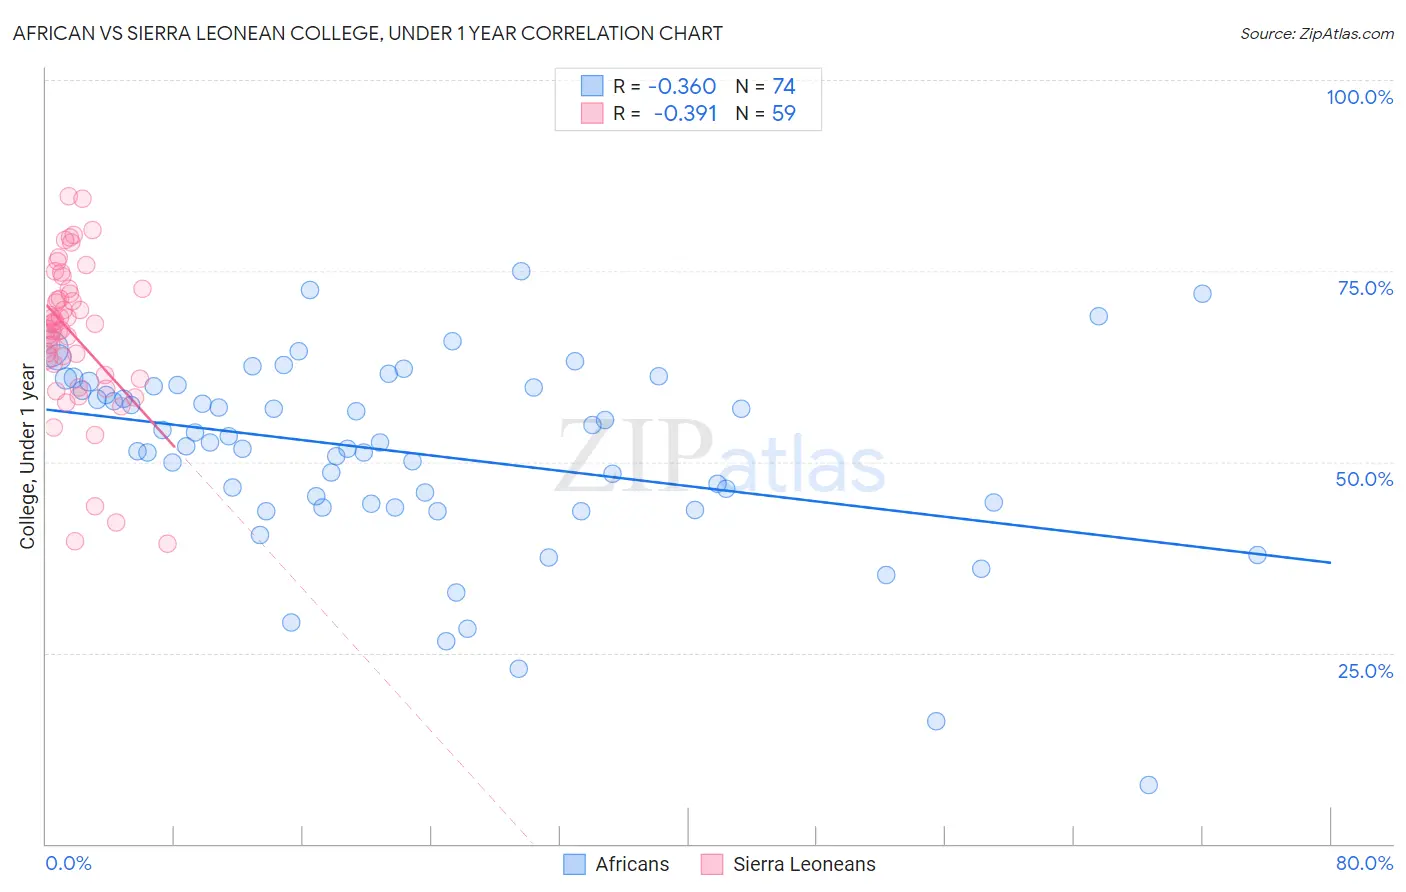
African vs Sierra Leonean College, Under 1 year Correlation Chart
The statistical analysis conducted on geographies consisting of 470,092,177 people shows a mild negative correlation between the proportion of Africans and percentage of population with at least college, under 1 year education in the United States with a correlation coefficient (R) of -0.360 and weighted average of 61.1%. Similarly, the statistical analysis conducted on geographies consisting of 83,362,711 people shows a mild negative correlation between the proportion of Sierra Leoneans and percentage of population with at least college, under 1 year education in the United States with a correlation coefficient (R) of -0.391 and weighted average of 66.0%, a difference of 7.9%.
College, Under 1 year Correlation Summary
| Measurement | African | Sierra Leonean |
| Minimum | 7.7% | 39.3% |
| Maximum | 75.0% | 84.7% |
| Range | 67.3% | 45.5% |
| Mean | 51.2% | 66.7% |
| Median | 52.5% | 68.1% |
| Interquartile 25% (IQ1) | 44.5% | 61.4% |
| Interquartile 75% (IQ3) | 59.9% | 72.6% |
| Interquartile Range (IQR) | 15.4% | 11.2% |
| Standard Deviation (Sample) | 12.7% | 9.9% |
| Standard Deviation (Population) | 12.6% | 9.8% |
Similar Demographics by College, Under 1 year
Demographics Similar to Africans by College, Under 1 year
In terms of college, under 1 year, the demographic groups most similar to Africans are Blackfeet (61.1%, a difference of 0.030%), Barbadian (61.1%, a difference of 0.040%), Shoshone (61.1%, a difference of 0.050%), Trinidadian and Tobagonian (61.1%, a difference of 0.11%), and Immigrants from Bahamas (61.1%, a difference of 0.11%).
| Demographics | Rating | Rank | College, Under 1 year |
| Immigrants | Cambodia | 0.4 /100 | #254 | Tragic 61.5% |
| Comanche | 0.4 /100 | #255 | Tragic 61.4% |
| Bangladeshis | 0.4 /100 | #256 | Tragic 61.4% |
| Immigrants | Laos | 0.3 /100 | #257 | Tragic 61.3% |
| Immigrants | Bangladesh | 0.3 /100 | #258 | Tragic 61.3% |
| Indonesians | 0.3 /100 | #259 | Tragic 61.2% |
| Blackfeet | 0.3 /100 | #260 | Tragic 61.1% |
| Africans | 0.3 /100 | #261 | Tragic 61.1% |
| Barbadians | 0.2 /100 | #262 | Tragic 61.1% |
| Shoshone | 0.2 /100 | #263 | Tragic 61.1% |
| Trinidadians and Tobagonians | 0.2 /100 | #264 | Tragic 61.1% |
| Immigrants | Bahamas | 0.2 /100 | #265 | Tragic 61.1% |
| Alaskan Athabascans | 0.2 /100 | #266 | Tragic 61.0% |
| Americans | 0.2 /100 | #267 | Tragic 61.0% |
| Immigrants | Trinidad and Tobago | 0.1 /100 | #268 | Tragic 60.7% |
Demographics Similar to Sierra Leoneans by College, Under 1 year
In terms of college, under 1 year, the demographic groups most similar to Sierra Leoneans are Celtic (65.9%, a difference of 0.030%), Tlingit-Haida (65.9%, a difference of 0.070%), Albanian (65.9%, a difference of 0.080%), Brazilian (65.9%, a difference of 0.090%), and Welsh (66.0%, a difference of 0.10%).
| Demographics | Rating | Rank | College, Under 1 year |
| Immigrants | Iraq | 77.1 /100 | #150 | Good 66.3% |
| Immigrants | Sudan | 76.0 /100 | #151 | Good 66.2% |
| Sudanese | 74.1 /100 | #152 | Good 66.2% |
| Belgians | 73.7 /100 | #153 | Good 66.2% |
| Immigrants | Eritrea | 71.9 /100 | #154 | Good 66.1% |
| Irish | 70.3 /100 | #155 | Good 66.0% |
| Welsh | 69.9 /100 | #156 | Good 66.0% |
| Sierra Leoneans | 67.8 /100 | #157 | Good 66.0% |
| Celtics | 67.3 /100 | #158 | Good 65.9% |
| Tlingit-Haida | 66.4 /100 | #159 | Good 65.9% |
| Albanians | 66.1 /100 | #160 | Good 65.9% |
| Brazilians | 66.0 /100 | #161 | Good 65.9% |
| Koreans | 65.3 /100 | #162 | Good 65.9% |
| Somalis | 62.7 /100 | #163 | Good 65.8% |
| Czechoslovakians | 62.6 /100 | #164 | Good 65.8% |