Ottawa vs Sierra Leonean Currently Married
COMPARE
Ottawa
Sierra Leonean
Currently Married
Currently Married Comparison
Ottawa
Sierra Leoneans
46.5%
CURRENTLY MARRIED
43.0/ 100
METRIC RATING
181st/ 347
METRIC RANK
43.4%
CURRENTLY MARRIED
0.1/ 100
METRIC RATING
276th/ 347
METRIC RANK
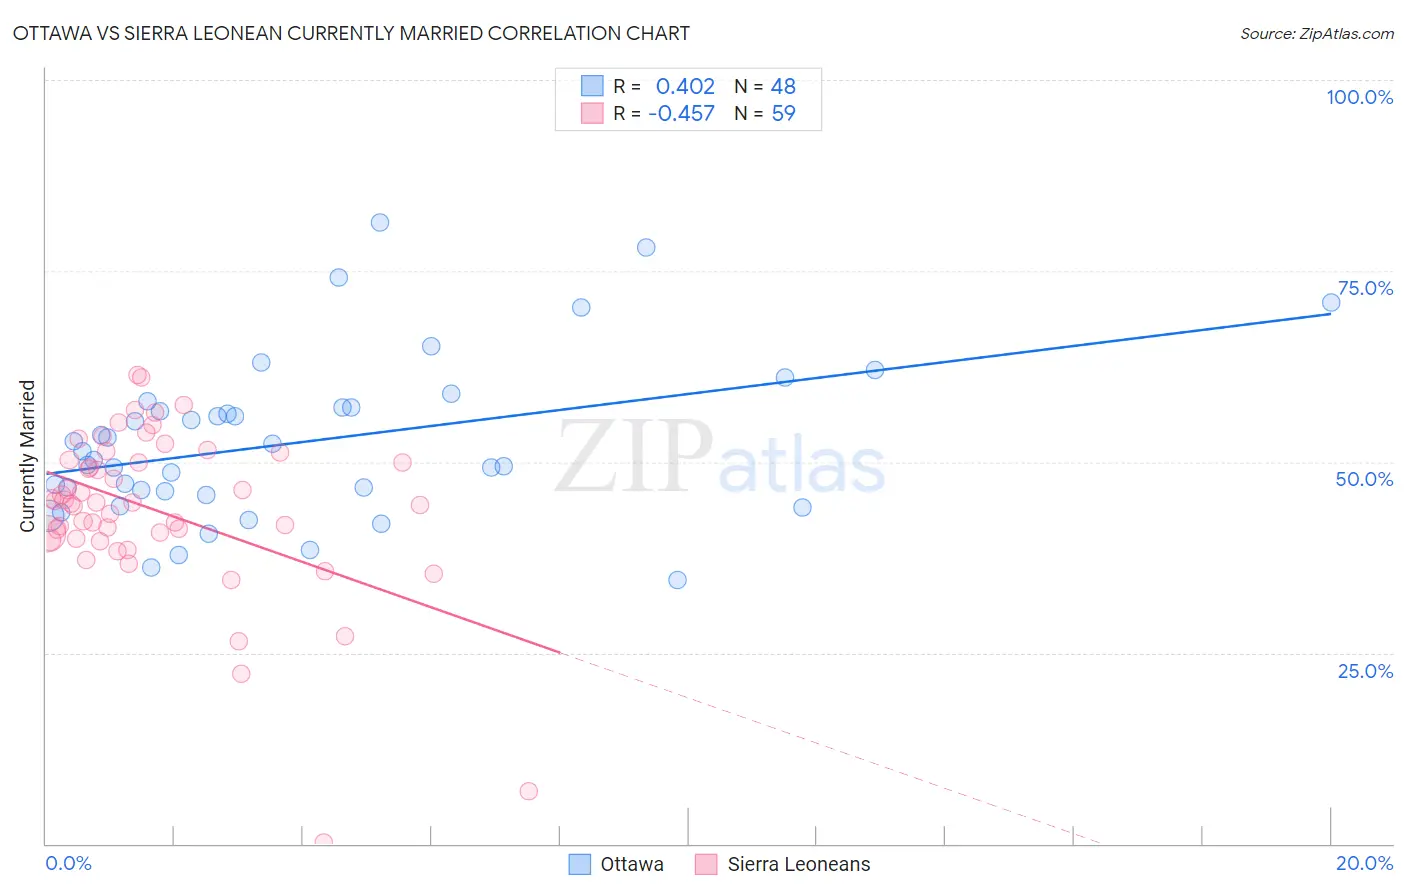
Ottawa vs Sierra Leonean Currently Married Correlation Chart
The statistical analysis conducted on geographies consisting of 49,956,726 people shows a moderate positive correlation between the proportion of Ottawa and percentage of population currently married in the United States with a correlation coefficient (R) of 0.402 and weighted average of 46.5%. Similarly, the statistical analysis conducted on geographies consisting of 83,363,036 people shows a moderate negative correlation between the proportion of Sierra Leoneans and percentage of population currently married in the United States with a correlation coefficient (R) of -0.457 and weighted average of 43.4%, a difference of 7.1%.
Currently Married Correlation Summary
| Measurement | Ottawa | Sierra Leonean |
| Minimum | 34.6% | 0.10% |
| Maximum | 81.4% | 61.4% |
| Range | 46.8% | 61.3% |
| Mean | 52.6% | 43.6% |
| Median | 50.9% | 44.7% |
| Interquartile 25% (IQ1) | 45.9% | 39.9% |
| Interquartile 75% (IQ3) | 57.2% | 50.3% |
| Interquartile Range (IQR) | 11.2% | 10.4% |
| Standard Deviation (Sample) | 10.5% | 10.9% |
| Standard Deviation (Population) | 10.4% | 10.8% |
Similar Demographics by Currently Married
Demographics Similar to Ottawa by Currently Married
In terms of currently married, the demographic groups most similar to Ottawa are Costa Rican (46.5%, a difference of 0.020%), Potawatomi (46.5%, a difference of 0.040%), Immigrants from Oceania (46.5%, a difference of 0.060%), Immigrants from Northern Africa (46.5%, a difference of 0.13%), and Brazilian (46.4%, a difference of 0.14%).
| Demographics | Rating | Rank | Currently Married |
| Peruvians | 50.0 /100 | #174 | Average 46.6% |
| Immigrants | Brazil | 49.9 /100 | #175 | Average 46.6% |
| Hawaiians | 48.6 /100 | #176 | Average 46.6% |
| Israelis | 48.6 /100 | #177 | Average 46.6% |
| Chickasaw | 47.8 /100 | #178 | Average 46.6% |
| Immigrants | Oceania | 44.6 /100 | #179 | Average 46.5% |
| Costa Ricans | 43.7 /100 | #180 | Average 46.5% |
| Ottawa | 43.0 /100 | #181 | Average 46.5% |
| Potawatomi | 41.9 /100 | #182 | Average 46.5% |
| Immigrants | Northern Africa | 39.7 /100 | #183 | Fair 46.5% |
| Brazilians | 39.3 /100 | #184 | Fair 46.4% |
| Mongolians | 37.6 /100 | #185 | Fair 46.4% |
| Immigrants | Chile | 36.8 /100 | #186 | Fair 46.4% |
| Immigrants | Peru | 35.3 /100 | #187 | Fair 46.4% |
| Colombians | 31.8 /100 | #188 | Fair 46.3% |
Demographics Similar to Sierra Leoneans by Currently Married
In terms of currently married, the demographic groups most similar to Sierra Leoneans are Immigrants from Nigeria (43.4%, a difference of 0.010%), Colville (43.4%, a difference of 0.030%), Nigerian (43.4%, a difference of 0.050%), Yaqui (43.4%, a difference of 0.070%), and Indonesian (43.5%, a difference of 0.11%).
| Demographics | Rating | Rank | Currently Married |
| Immigrants | Sudan | 0.1 /100 | #269 | Tragic 43.5% |
| Salvadorans | 0.1 /100 | #270 | Tragic 43.5% |
| Bermudans | 0.1 /100 | #271 | Tragic 43.5% |
| Indonesians | 0.1 /100 | #272 | Tragic 43.5% |
| Yaqui | 0.1 /100 | #273 | Tragic 43.4% |
| Nigerians | 0.1 /100 | #274 | Tragic 43.4% |
| Colville | 0.1 /100 | #275 | Tragic 43.4% |
| Sierra Leoneans | 0.1 /100 | #276 | Tragic 43.4% |
| Immigrants | Nigeria | 0.1 /100 | #277 | Tragic 43.4% |
| Central Americans | 0.0 /100 | #278 | Tragic 43.3% |
| Central American Indians | 0.0 /100 | #279 | Tragic 43.3% |
| Apache | 0.0 /100 | #280 | Tragic 43.2% |
| Chippewa | 0.0 /100 | #281 | Tragic 43.2% |
| Immigrants | Ecuador | 0.0 /100 | #282 | Tragic 43.2% |
| Kiowa | 0.0 /100 | #283 | Tragic 43.2% |