Scottish vs Sierra Leonean Currently Married
COMPARE
Scottish
Sierra Leonean
Currently Married
Currently Married Comparison
Scottish
Sierra Leoneans
49.2%
CURRENTLY MARRIED
99.8/ 100
METRIC RATING
21st/ 347
METRIC RANK
43.4%
CURRENTLY MARRIED
0.1/ 100
METRIC RATING
276th/ 347
METRIC RANK
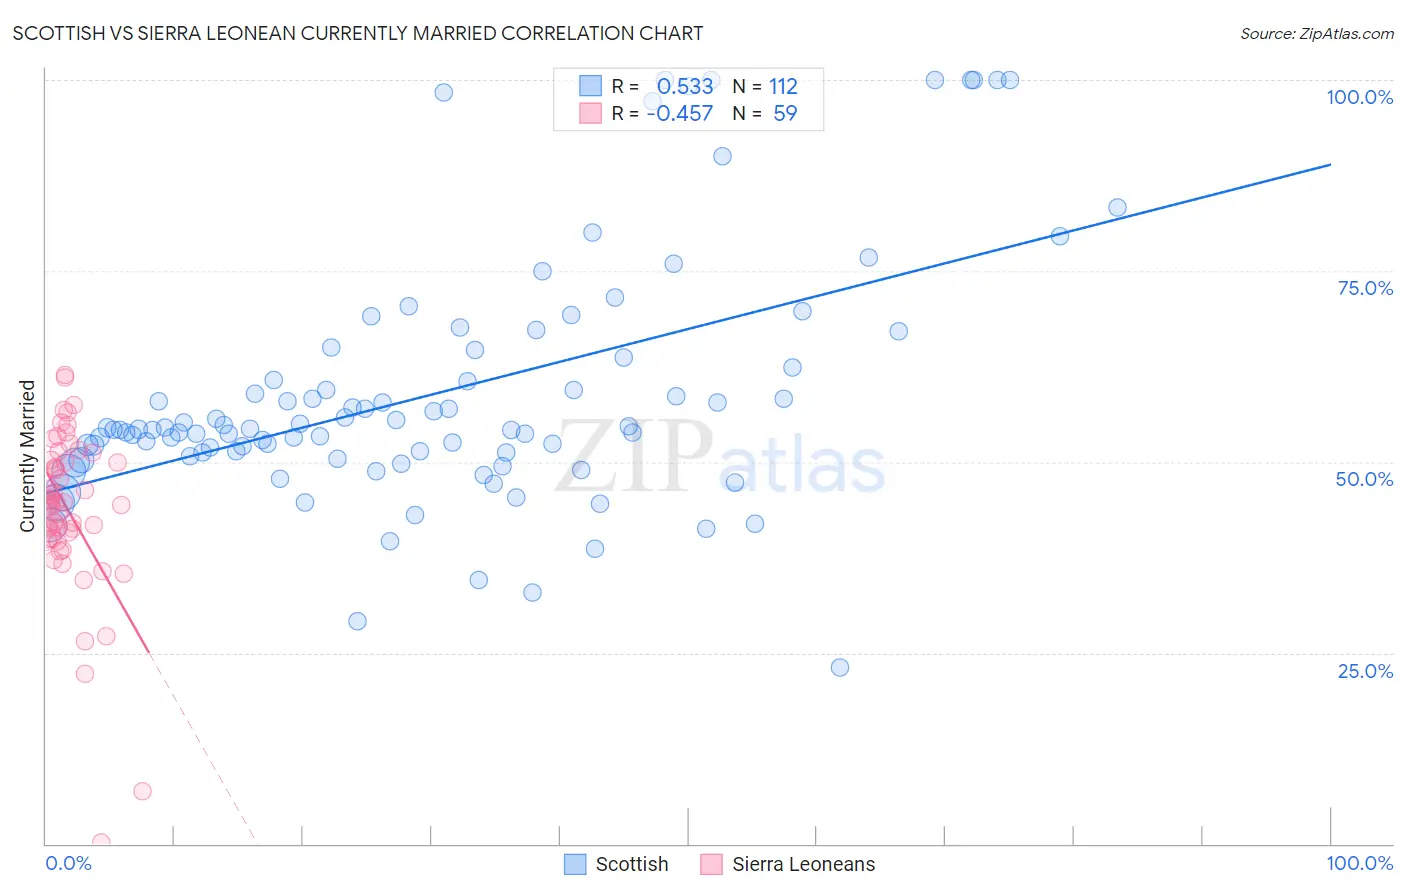
Scottish vs Sierra Leonean Currently Married Correlation Chart
The statistical analysis conducted on geographies consisting of 567,020,693 people shows a substantial positive correlation between the proportion of Scottish and percentage of population currently married in the United States with a correlation coefficient (R) of 0.533 and weighted average of 49.2%. Similarly, the statistical analysis conducted on geographies consisting of 83,363,036 people shows a moderate negative correlation between the proportion of Sierra Leoneans and percentage of population currently married in the United States with a correlation coefficient (R) of -0.457 and weighted average of 43.4%, a difference of 13.4%.
Currently Married Correlation Summary
| Measurement | Scottish | Sierra Leonean |
| Minimum | 23.0% | 0.10% |
| Maximum | 100.0% | 61.4% |
| Range | 77.0% | 61.3% |
| Mean | 59.0% | 43.6% |
| Median | 54.2% | 44.7% |
| Interquartile 25% (IQ1) | 51.0% | 39.9% |
| Interquartile 75% (IQ3) | 63.0% | 50.3% |
| Interquartile Range (IQR) | 12.1% | 10.4% |
| Standard Deviation (Sample) | 16.3% | 10.9% |
| Standard Deviation (Population) | 16.2% | 10.8% |
Similar Demographics by Currently Married
Demographics Similar to Scottish by Currently Married
In terms of currently married, the demographic groups most similar to Scottish are Luxembourger (49.3%, a difference of 0.11%), Bulgarian (49.1%, a difference of 0.22%), European (49.3%, a difference of 0.24%), Immigrants from Scotland (49.3%, a difference of 0.26%), and Immigrants from Pakistan (49.1%, a difference of 0.33%).
| Demographics | Rating | Rank | Currently Married |
| Germans | 99.9 /100 | #14 | Exceptional 49.6% |
| Pennsylvania Germans | 99.9 /100 | #15 | Exceptional 49.6% |
| Chinese | 99.9 /100 | #16 | Exceptional 49.5% |
| Scandinavians | 99.9 /100 | #17 | Exceptional 49.5% |
| Immigrants | Scotland | 99.8 /100 | #18 | Exceptional 49.3% |
| Europeans | 99.8 /100 | #19 | Exceptional 49.3% |
| Luxembourgers | 99.8 /100 | #20 | Exceptional 49.3% |
| Scottish | 99.8 /100 | #21 | Exceptional 49.2% |
| Bulgarians | 99.7 /100 | #22 | Exceptional 49.1% |
| Immigrants | Pakistan | 99.7 /100 | #23 | Exceptional 49.1% |
| Lithuanians | 99.6 /100 | #24 | Exceptional 49.0% |
| Maltese | 99.6 /100 | #25 | Exceptional 49.0% |
| Immigrants | Korea | 99.6 /100 | #26 | Exceptional 49.0% |
| Burmese | 99.6 /100 | #27 | Exceptional 48.9% |
| Welsh | 99.5 /100 | #28 | Exceptional 48.9% |
Demographics Similar to Sierra Leoneans by Currently Married
In terms of currently married, the demographic groups most similar to Sierra Leoneans are Immigrants from Nigeria (43.4%, a difference of 0.010%), Colville (43.4%, a difference of 0.030%), Nigerian (43.4%, a difference of 0.050%), Yaqui (43.4%, a difference of 0.070%), and Indonesian (43.5%, a difference of 0.11%).
| Demographics | Rating | Rank | Currently Married |
| Immigrants | Sudan | 0.1 /100 | #269 | Tragic 43.5% |
| Salvadorans | 0.1 /100 | #270 | Tragic 43.5% |
| Bermudans | 0.1 /100 | #271 | Tragic 43.5% |
| Indonesians | 0.1 /100 | #272 | Tragic 43.5% |
| Yaqui | 0.1 /100 | #273 | Tragic 43.4% |
| Nigerians | 0.1 /100 | #274 | Tragic 43.4% |
| Colville | 0.1 /100 | #275 | Tragic 43.4% |
| Sierra Leoneans | 0.1 /100 | #276 | Tragic 43.4% |
| Immigrants | Nigeria | 0.1 /100 | #277 | Tragic 43.4% |
| Central Americans | 0.0 /100 | #278 | Tragic 43.3% |
| Central American Indians | 0.0 /100 | #279 | Tragic 43.3% |
| Apache | 0.0 /100 | #280 | Tragic 43.2% |
| Chippewa | 0.0 /100 | #281 | Tragic 43.2% |
| Immigrants | Ecuador | 0.0 /100 | #282 | Tragic 43.2% |
| Kiowa | 0.0 /100 | #283 | Tragic 43.2% |