African vs Korean Currently Married
COMPARE
African
Korean
Currently Married
Currently Married Comparison
Africans
Koreans
41.8%
CURRENTLY MARRIED
0.0/ 100
METRIC RATING
307th/ 347
METRIC RANK
47.9%
CURRENTLY MARRIED
95.4/ 100
METRIC RATING
92nd/ 347
METRIC RANK
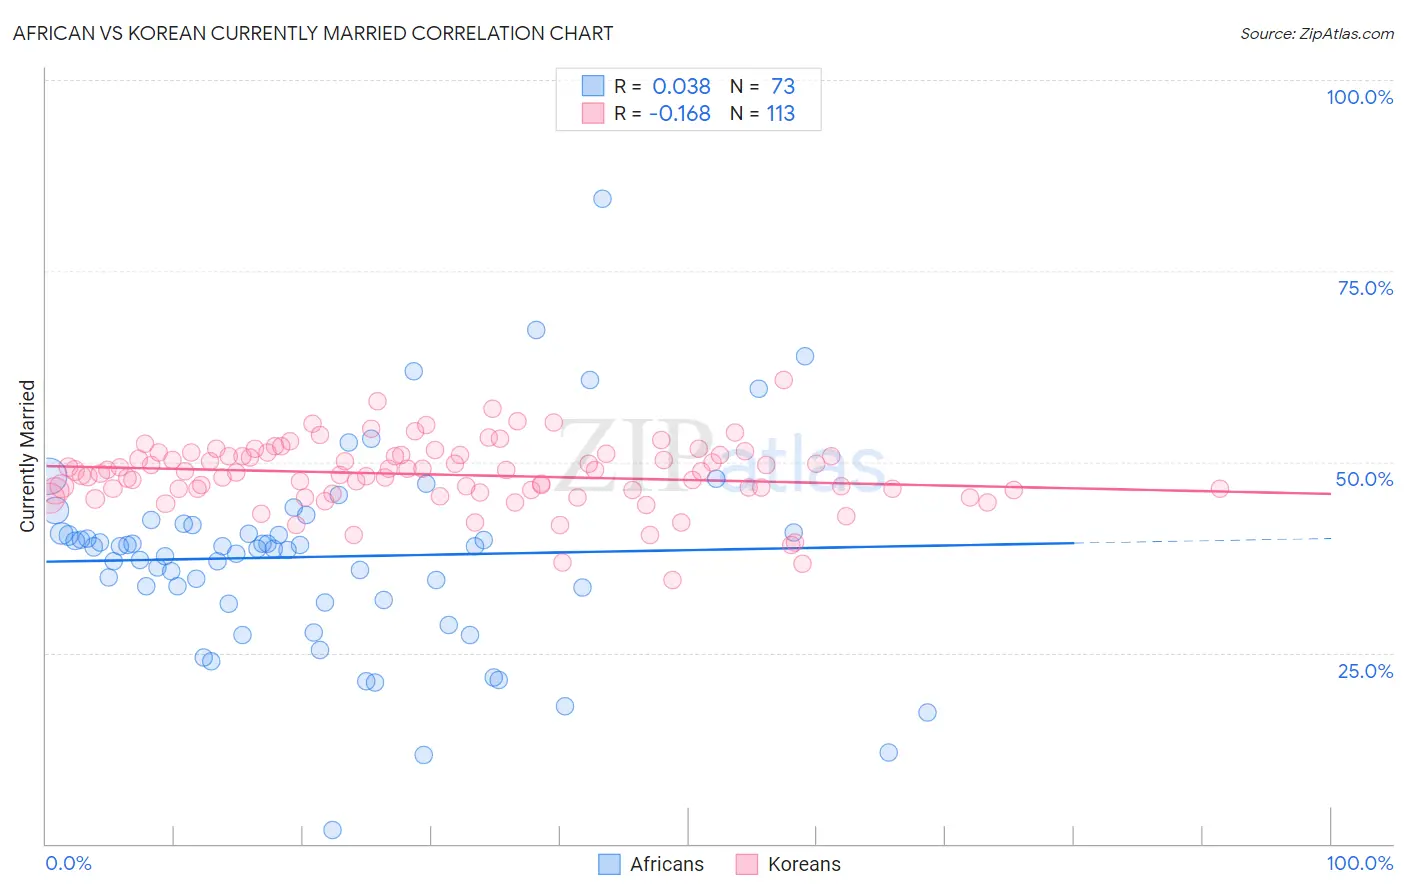
African vs Korean Currently Married Correlation Chart
The statistical analysis conducted on geographies consisting of 470,023,481 people shows no correlation between the proportion of Africans and percentage of population currently married in the United States with a correlation coefficient (R) of 0.038 and weighted average of 41.8%. Similarly, the statistical analysis conducted on geographies consisting of 510,845,444 people shows a poor negative correlation between the proportion of Koreans and percentage of population currently married in the United States with a correlation coefficient (R) of -0.168 and weighted average of 47.9%, a difference of 14.6%.
Currently Married Correlation Summary
| Measurement | African | Korean |
| Minimum | 1.8% | 34.5% |
| Maximum | 84.5% | 60.8% |
| Range | 82.7% | 26.3% |
| Mean | 37.6% | 48.3% |
| Median | 38.9% | 48.7% |
| Interquartile 25% (IQ1) | 31.7% | 46.3% |
| Interquartile 75% (IQ3) | 41.2% | 50.9% |
| Interquartile Range (IQR) | 9.4% | 4.7% |
| Standard Deviation (Sample) | 12.9% | 4.3% |
| Standard Deviation (Population) | 12.8% | 4.3% |
Similar Demographics by Currently Married
Demographics Similar to Africans by Currently Married
In terms of currently married, the demographic groups most similar to Africans are Immigrants from Belize (41.8%, a difference of 0.040%), Immigrants from Guyana (41.9%, a difference of 0.13%), Immigrants from Trinidad and Tobago (41.9%, a difference of 0.14%), Immigrants from Liberia (41.8%, a difference of 0.15%), and Immigrants from Bahamas (41.9%, a difference of 0.18%).
| Demographics | Rating | Rank | Currently Married |
| Belizeans | 0.0 /100 | #300 | Tragic 42.2% |
| Immigrants | Yemen | 0.0 /100 | #301 | Tragic 42.1% |
| Immigrants | Zaire | 0.0 /100 | #302 | Tragic 42.0% |
| Sioux | 0.0 /100 | #303 | Tragic 41.9% |
| Immigrants | Bahamas | 0.0 /100 | #304 | Tragic 41.9% |
| Immigrants | Trinidad and Tobago | 0.0 /100 | #305 | Tragic 41.9% |
| Immigrants | Guyana | 0.0 /100 | #306 | Tragic 41.9% |
| Africans | 0.0 /100 | #307 | Tragic 41.8% |
| Immigrants | Belize | 0.0 /100 | #308 | Tragic 41.8% |
| Immigrants | Liberia | 0.0 /100 | #309 | Tragic 41.8% |
| Guyanese | 0.0 /100 | #310 | Tragic 41.6% |
| Trinidadians and Tobagonians | 0.0 /100 | #311 | Tragic 41.5% |
| Somalis | 0.0 /100 | #312 | Tragic 41.5% |
| Jamaicans | 0.0 /100 | #313 | Tragic 41.4% |
| West Indians | 0.0 /100 | #314 | Tragic 41.3% |
Demographics Similar to Koreans by Currently Married
In terms of currently married, the demographic groups most similar to Koreans are Immigrants from Bolivia (47.9%, a difference of 0.040%), Lebanese (47.9%, a difference of 0.050%), American (48.0%, a difference of 0.070%), Native Hawaiian (47.9%, a difference of 0.070%), and Indian (Asian) (48.0%, a difference of 0.090%).
| Demographics | Rating | Rank | Currently Married |
| French Canadians | 96.3 /100 | #85 | Exceptional 48.0% |
| Immigrants | Japan | 96.2 /100 | #86 | Exceptional 48.0% |
| Jordanians | 96.2 /100 | #87 | Exceptional 48.0% |
| Immigrants | Eastern Europe | 96.1 /100 | #88 | Exceptional 48.0% |
| Indians (Asian) | 95.8 /100 | #89 | Exceptional 48.0% |
| Americans | 95.7 /100 | #90 | Exceptional 48.0% |
| Immigrants | Bolivia | 95.6 /100 | #91 | Exceptional 47.9% |
| Koreans | 95.4 /100 | #92 | Exceptional 47.9% |
| Lebanese | 95.1 /100 | #93 | Exceptional 47.9% |
| Native Hawaiians | 95.0 /100 | #94 | Exceptional 47.9% |
| Immigrants | Bulgaria | 94.8 /100 | #95 | Exceptional 47.9% |
| Egyptians | 94.8 /100 | #96 | Exceptional 47.9% |
| Immigrants | Ukraine | 94.8 /100 | #97 | Exceptional 47.9% |
| Immigrants | China | 94.7 /100 | #98 | Exceptional 47.9% |
| Immigrants | Sweden | 94.3 /100 | #99 | Exceptional 47.8% |