Tongan vs Sierra Leonean Currently Married
COMPARE
Tongan
Sierra Leonean
Currently Married
Currently Married Comparison
Tongans
Sierra Leoneans
48.3%
CURRENTLY MARRIED
98.2/ 100
METRIC RATING
66th/ 347
METRIC RANK
43.4%
CURRENTLY MARRIED
0.1/ 100
METRIC RATING
276th/ 347
METRIC RANK
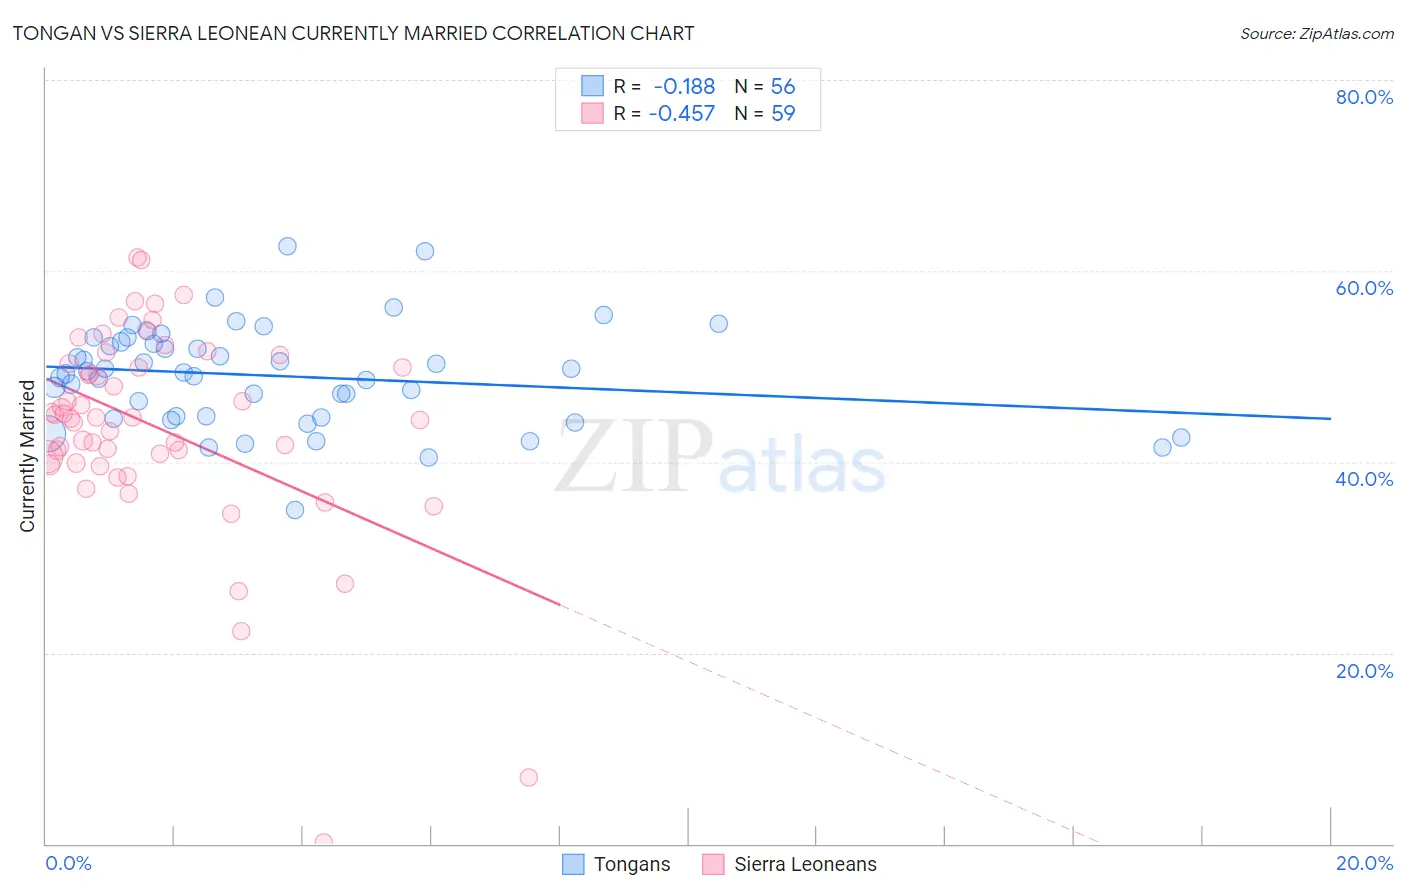
Tongan vs Sierra Leonean Currently Married Correlation Chart
The statistical analysis conducted on geographies consisting of 102,907,109 people shows a poor negative correlation between the proportion of Tongans and percentage of population currently married in the United States with a correlation coefficient (R) of -0.188 and weighted average of 48.3%. Similarly, the statistical analysis conducted on geographies consisting of 83,363,036 people shows a moderate negative correlation between the proportion of Sierra Leoneans and percentage of population currently married in the United States with a correlation coefficient (R) of -0.457 and weighted average of 43.4%, a difference of 11.3%.
Currently Married Correlation Summary
| Measurement | Tongan | Sierra Leonean |
| Minimum | 35.0% | 0.10% |
| Maximum | 62.6% | 61.4% |
| Range | 27.6% | 61.3% |
| Mean | 49.0% | 43.6% |
| Median | 49.3% | 44.7% |
| Interquartile 25% (IQ1) | 44.7% | 39.9% |
| Interquartile 75% (IQ3) | 52.5% | 50.3% |
| Interquartile Range (IQR) | 7.8% | 10.4% |
| Standard Deviation (Sample) | 5.3% | 10.9% |
| Standard Deviation (Population) | 5.3% | 10.8% |
Similar Demographics by Currently Married
Demographics Similar to Tongans by Currently Married
In terms of currently married, the demographic groups most similar to Tongans are Slovak (48.3%, a difference of 0.010%), Immigrants from England (48.3%, a difference of 0.020%), Immigrants from Czechoslovakia (48.4%, a difference of 0.030%), Ukrainian (48.4%, a difference of 0.030%), and Slavic (48.4%, a difference of 0.040%).
| Demographics | Rating | Rank | Currently Married |
| Immigrants | Ireland | 98.5 /100 | #59 | Exceptional 48.4% |
| Immigrants | Romania | 98.5 /100 | #60 | Exceptional 48.4% |
| Romanians | 98.5 /100 | #61 | Exceptional 48.4% |
| Asians | 98.5 /100 | #62 | Exceptional 48.4% |
| Slavs | 98.3 /100 | #63 | Exceptional 48.4% |
| Immigrants | Czechoslovakia | 98.3 /100 | #64 | Exceptional 48.4% |
| Ukrainians | 98.3 /100 | #65 | Exceptional 48.4% |
| Tongans | 98.2 /100 | #66 | Exceptional 48.3% |
| Slovaks | 98.2 /100 | #67 | Exceptional 48.3% |
| Immigrants | England | 98.2 /100 | #68 | Exceptional 48.3% |
| Canadians | 98.1 /100 | #69 | Exceptional 48.3% |
| Immigrants | Asia | 97.9 /100 | #70 | Exceptional 48.3% |
| Macedonians | 97.9 /100 | #71 | Exceptional 48.3% |
| Immigrants | Lebanon | 97.6 /100 | #72 | Exceptional 48.2% |
| Immigrants | Eastern Asia | 97.5 /100 | #73 | Exceptional 48.2% |
Demographics Similar to Sierra Leoneans by Currently Married
In terms of currently married, the demographic groups most similar to Sierra Leoneans are Immigrants from Nigeria (43.4%, a difference of 0.010%), Colville (43.4%, a difference of 0.030%), Nigerian (43.4%, a difference of 0.050%), Yaqui (43.4%, a difference of 0.070%), and Indonesian (43.5%, a difference of 0.11%).
| Demographics | Rating | Rank | Currently Married |
| Immigrants | Sudan | 0.1 /100 | #269 | Tragic 43.5% |
| Salvadorans | 0.1 /100 | #270 | Tragic 43.5% |
| Bermudans | 0.1 /100 | #271 | Tragic 43.5% |
| Indonesians | 0.1 /100 | #272 | Tragic 43.5% |
| Yaqui | 0.1 /100 | #273 | Tragic 43.4% |
| Nigerians | 0.1 /100 | #274 | Tragic 43.4% |
| Colville | 0.1 /100 | #275 | Tragic 43.4% |
| Sierra Leoneans | 0.1 /100 | #276 | Tragic 43.4% |
| Immigrants | Nigeria | 0.1 /100 | #277 | Tragic 43.4% |
| Central Americans | 0.0 /100 | #278 | Tragic 43.3% |
| Central American Indians | 0.0 /100 | #279 | Tragic 43.3% |
| Apache | 0.0 /100 | #280 | Tragic 43.2% |
| Chippewa | 0.0 /100 | #281 | Tragic 43.2% |
| Immigrants | Ecuador | 0.0 /100 | #282 | Tragic 43.2% |
| Kiowa | 0.0 /100 | #283 | Tragic 43.2% |