Czech vs Sierra Leonean Currently Married
COMPARE
Czech
Sierra Leonean
Currently Married
Currently Married Comparison
Czechs
Sierra Leoneans
49.9%
CURRENTLY MARRIED
99.9/ 100
METRIC RATING
9th/ 347
METRIC RANK
43.4%
CURRENTLY MARRIED
0.1/ 100
METRIC RATING
276th/ 347
METRIC RANK
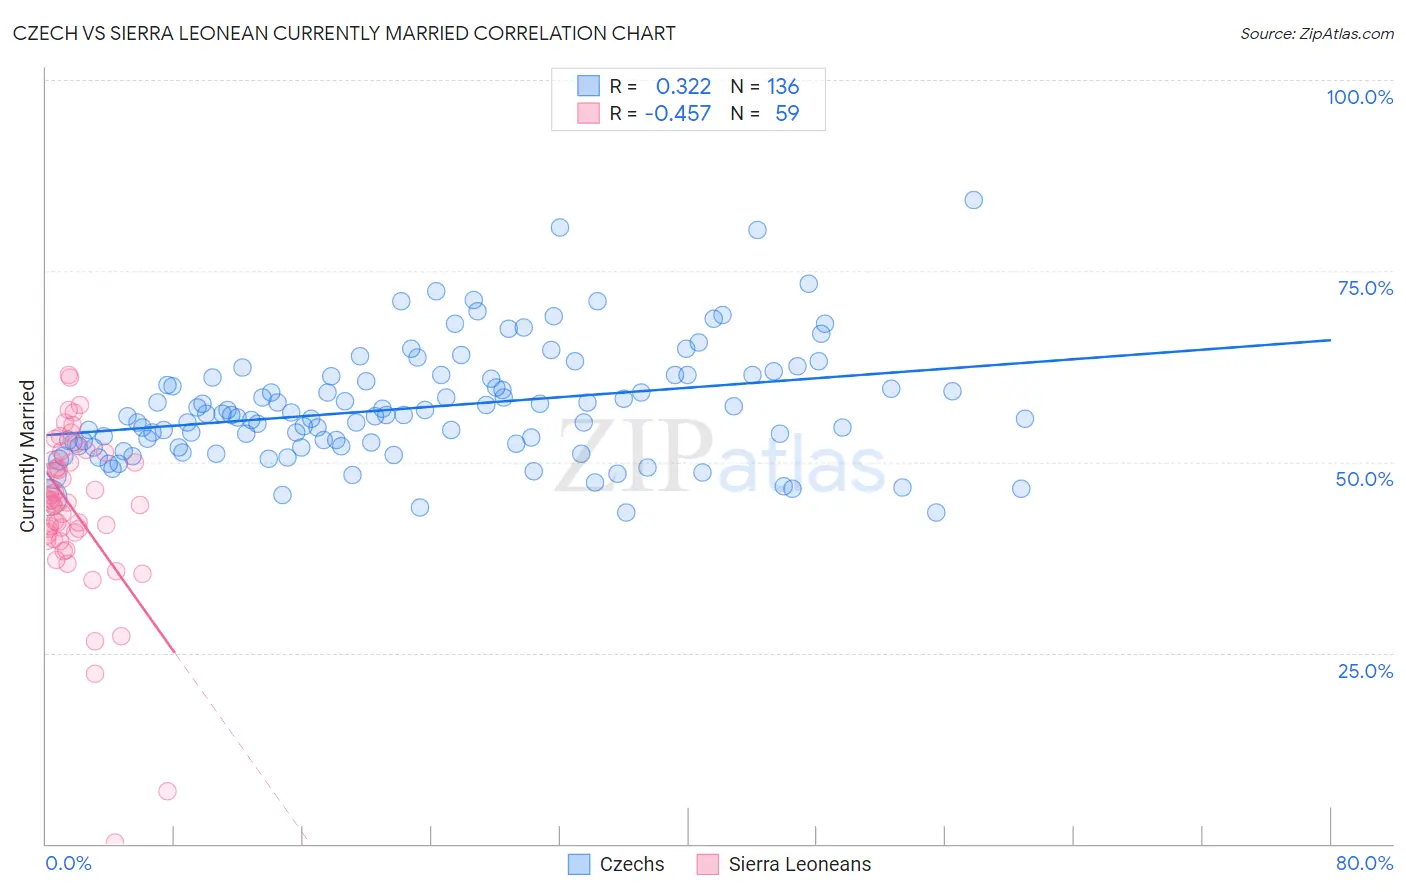
Czech vs Sierra Leonean Currently Married Correlation Chart
The statistical analysis conducted on geographies consisting of 484,743,369 people shows a mild positive correlation between the proportion of Czechs and percentage of population currently married in the United States with a correlation coefficient (R) of 0.322 and weighted average of 49.9%. Similarly, the statistical analysis conducted on geographies consisting of 83,363,036 people shows a moderate negative correlation between the proportion of Sierra Leoneans and percentage of population currently married in the United States with a correlation coefficient (R) of -0.457 and weighted average of 43.4%, a difference of 14.8%.
Currently Married Correlation Summary
| Measurement | Czech | Sierra Leonean |
| Minimum | 43.4% | 0.10% |
| Maximum | 84.3% | 61.4% |
| Range | 40.9% | 61.3% |
| Mean | 57.1% | 43.6% |
| Median | 56.0% | 44.7% |
| Interquartile 25% (IQ1) | 52.0% | 39.9% |
| Interquartile 75% (IQ3) | 61.1% | 50.3% |
| Interquartile Range (IQR) | 9.1% | 10.4% |
| Standard Deviation (Sample) | 7.5% | 10.9% |
| Standard Deviation (Population) | 7.5% | 10.8% |
Similar Demographics by Currently Married
Demographics Similar to Czechs by Currently Married
In terms of currently married, the demographic groups most similar to Czechs are Swedish (50.0%, a difference of 0.19%), Filipino (49.7%, a difference of 0.26%), English (49.7%, a difference of 0.27%), Swiss (49.7%, a difference of 0.27%), and Immigrants from South Central Asia (50.0%, a difference of 0.32%).
| Demographics | Rating | Rank | Currently Married |
| Thais | 100.0 /100 | #2 | Exceptional 50.9% |
| Assyrians/Chaldeans/Syriacs | 100.0 /100 | #3 | Exceptional 50.8% |
| Immigrants | Taiwan | 100.0 /100 | #4 | Exceptional 50.7% |
| Danes | 100.0 /100 | #5 | Exceptional 50.5% |
| Norwegians | 100.0 /100 | #6 | Exceptional 50.2% |
| Immigrants | South Central Asia | 100.0 /100 | #7 | Exceptional 50.0% |
| Swedes | 100.0 /100 | #8 | Exceptional 50.0% |
| Czechs | 99.9 /100 | #9 | Exceptional 49.9% |
| Filipinos | 99.9 /100 | #10 | Exceptional 49.7% |
| English | 99.9 /100 | #11 | Exceptional 49.7% |
| Swiss | 99.9 /100 | #12 | Exceptional 49.7% |
| Dutch | 99.9 /100 | #13 | Exceptional 49.6% |
| Germans | 99.9 /100 | #14 | Exceptional 49.6% |
| Pennsylvania Germans | 99.9 /100 | #15 | Exceptional 49.6% |
| Chinese | 99.9 /100 | #16 | Exceptional 49.5% |
Demographics Similar to Sierra Leoneans by Currently Married
In terms of currently married, the demographic groups most similar to Sierra Leoneans are Immigrants from Nigeria (43.4%, a difference of 0.010%), Colville (43.4%, a difference of 0.030%), Nigerian (43.4%, a difference of 0.050%), Yaqui (43.4%, a difference of 0.070%), and Indonesian (43.5%, a difference of 0.11%).
| Demographics | Rating | Rank | Currently Married |
| Immigrants | Sudan | 0.1 /100 | #269 | Tragic 43.5% |
| Salvadorans | 0.1 /100 | #270 | Tragic 43.5% |
| Bermudans | 0.1 /100 | #271 | Tragic 43.5% |
| Indonesians | 0.1 /100 | #272 | Tragic 43.5% |
| Yaqui | 0.1 /100 | #273 | Tragic 43.4% |
| Nigerians | 0.1 /100 | #274 | Tragic 43.4% |
| Colville | 0.1 /100 | #275 | Tragic 43.4% |
| Sierra Leoneans | 0.1 /100 | #276 | Tragic 43.4% |
| Immigrants | Nigeria | 0.1 /100 | #277 | Tragic 43.4% |
| Central Americans | 0.0 /100 | #278 | Tragic 43.3% |
| Central American Indians | 0.0 /100 | #279 | Tragic 43.3% |
| Apache | 0.0 /100 | #280 | Tragic 43.2% |
| Chippewa | 0.0 /100 | #281 | Tragic 43.2% |
| Immigrants | Ecuador | 0.0 /100 | #282 | Tragic 43.2% |
| Kiowa | 0.0 /100 | #283 | Tragic 43.2% |