African vs Sierra Leonean Householder Income Over 65 years
COMPARE
African
Sierra Leonean
Householder Income Over 65 years
Householder Income Over 65 years Comparison
Africans
Sierra Leoneans
$53,711
HOUSEHOLDER INCOME OVER 65 YEARS
0.0/ 100
METRIC RATING
291st/ 347
METRIC RANK
$65,038
HOUSEHOLDER INCOME OVER 65 YEARS
98.6/ 100
METRIC RATING
75th/ 347
METRIC RANK
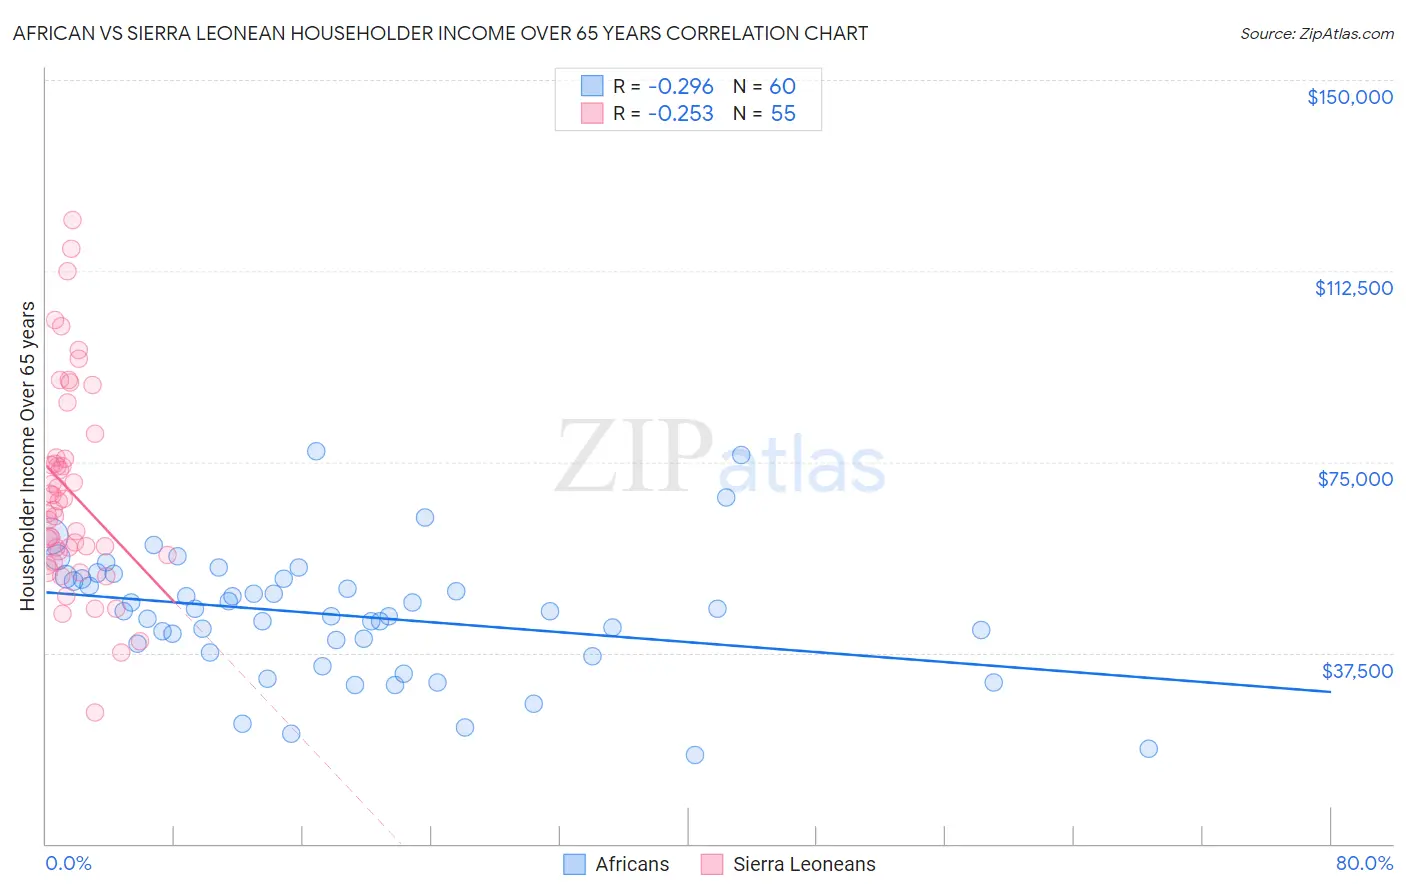
African vs Sierra Leonean Householder Income Over 65 years Correlation Chart
The statistical analysis conducted on geographies consisting of 467,455,412 people shows a weak negative correlation between the proportion of Africans and household income with householder over the age of 65 in the United States with a correlation coefficient (R) of -0.296 and weighted average of $53,711. Similarly, the statistical analysis conducted on geographies consisting of 83,245,915 people shows a weak negative correlation between the proportion of Sierra Leoneans and household income with householder over the age of 65 in the United States with a correlation coefficient (R) of -0.253 and weighted average of $65,038, a difference of 21.1%.
Householder Income Over 65 years Correlation Summary
| Measurement | African | Sierra Leonean |
| Minimum | $17,550 | $25,884 |
| Maximum | $77,178 | $122,529 |
| Range | $59,628 | $96,645 |
| Mean | $44,897 | $69,137 |
| Median | $45,715 | $65,524 |
| Interquartile 25% (IQ1) | $38,427 | $56,799 |
| Interquartile 75% (IQ3) | $51,942 | $75,960 |
| Interquartile Range (IQR) | $13,515 | $19,161 |
| Standard Deviation (Sample) | $12,357 | $20,039 |
| Standard Deviation (Population) | $12,253 | $19,856 |
Similar Demographics by Householder Income Over 65 years
Demographics Similar to Africans by Householder Income Over 65 years
In terms of householder income over 65 years, the demographic groups most similar to Africans are Chickasaw ($53,732, a difference of 0.040%), Iroquois ($53,737, a difference of 0.050%), Shoshone ($53,681, a difference of 0.060%), Paiute ($53,762, a difference of 0.090%), and Immigrants from Belize ($53,665, a difference of 0.090%).
| Demographics | Rating | Rank | Householder Income Over 65 years |
| Immigrants | Guatemala | 0.1 /100 | #284 | Tragic $53,950 |
| Mexicans | 0.1 /100 | #285 | Tragic $53,897 |
| Chippewa | 0.1 /100 | #286 | Tragic $53,847 |
| Immigrants | Barbados | 0.1 /100 | #287 | Tragic $53,766 |
| Paiute | 0.1 /100 | #288 | Tragic $53,762 |
| Iroquois | 0.1 /100 | #289 | Tragic $53,737 |
| Chickasaw | 0.1 /100 | #290 | Tragic $53,732 |
| Africans | 0.0 /100 | #291 | Tragic $53,711 |
| Shoshone | 0.0 /100 | #292 | Tragic $53,681 |
| Immigrants | Belize | 0.0 /100 | #293 | Tragic $53,665 |
| Senegalese | 0.0 /100 | #294 | Tragic $53,591 |
| Immigrants | Central America | 0.0 /100 | #295 | Tragic $53,420 |
| Immigrants | Somalia | 0.0 /100 | #296 | Tragic $53,333 |
| Immigrants | Latin America | 0.0 /100 | #297 | Tragic $53,265 |
| Central American Indians | 0.0 /100 | #298 | Tragic $53,232 |
Demographics Similar to Sierra Leoneans by Householder Income Over 65 years
In terms of householder income over 65 years, the demographic groups most similar to Sierra Leoneans are Ethiopian ($64,989, a difference of 0.080%), Immigrants from Canada ($64,952, a difference of 0.13%), Immigrants from Western Europe ($64,933, a difference of 0.16%), Hawaiian ($64,920, a difference of 0.18%), and Lithuanian ($65,209, a difference of 0.26%).
| Demographics | Rating | Rank | Householder Income Over 65 years |
| Egyptians | 99.1 /100 | #68 | Exceptional $65,441 |
| Samoans | 99.1 /100 | #69 | Exceptional $65,427 |
| Mongolians | 99.0 /100 | #70 | Exceptional $65,326 |
| Greeks | 98.9 /100 | #71 | Exceptional $65,306 |
| Argentineans | 98.9 /100 | #72 | Exceptional $65,246 |
| Immigrants | Ethiopia | 98.9 /100 | #73 | Exceptional $65,238 |
| Lithuanians | 98.8 /100 | #74 | Exceptional $65,209 |
| Sierra Leoneans | 98.6 /100 | #75 | Exceptional $65,038 |
| Ethiopians | 98.5 /100 | #76 | Exceptional $64,989 |
| Immigrants | Canada | 98.5 /100 | #77 | Exceptional $64,952 |
| Immigrants | Western Europe | 98.5 /100 | #78 | Exceptional $64,933 |
| Hawaiians | 98.4 /100 | #79 | Exceptional $64,920 |
| Immigrants | North America | 98.3 /100 | #80 | Exceptional $64,856 |
| Immigrants | Europe | 98.3 /100 | #81 | Exceptional $64,828 |
| Immigrants | Fiji | 98.2 /100 | #82 | Exceptional $64,795 |