African vs Native/Alaskan Householder Income Over 65 years
COMPARE
African
Native/Alaskan
Householder Income Over 65 years
Householder Income Over 65 years Comparison
Africans
Natives/Alaskans
$53,711
HOUSEHOLDER INCOME OVER 65 YEARS
0.0/ 100
METRIC RATING
291st/ 347
METRIC RANK
$52,081
HOUSEHOLDER INCOME OVER 65 YEARS
0.0/ 100
METRIC RATING
314th/ 347
METRIC RANK
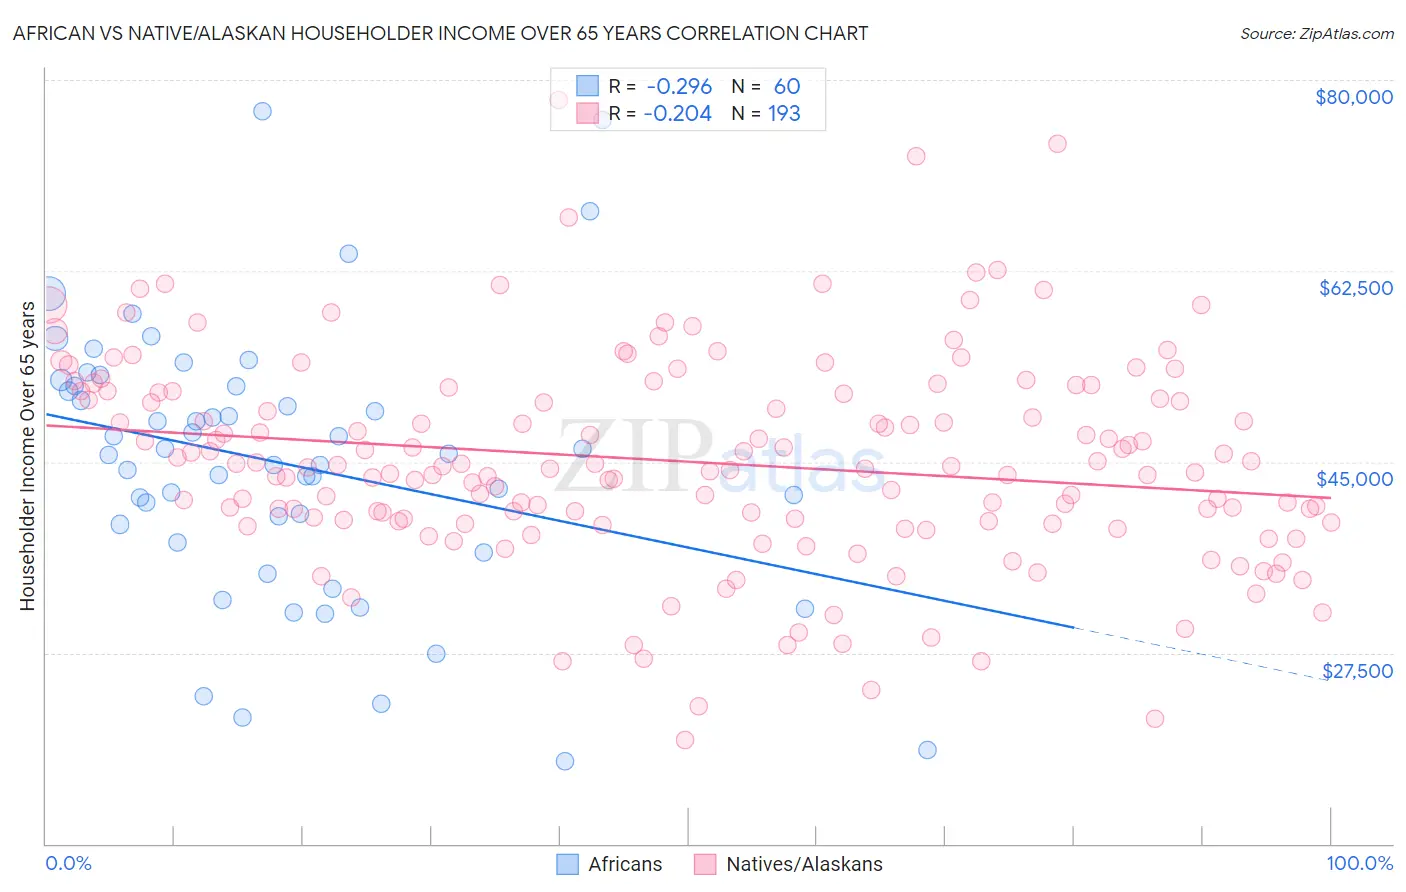
African vs Native/Alaskan Householder Income Over 65 years Correlation Chart
The statistical analysis conducted on geographies consisting of 467,455,412 people shows a weak negative correlation between the proportion of Africans and household income with householder over the age of 65 in the United States with a correlation coefficient (R) of -0.296 and weighted average of $53,711. Similarly, the statistical analysis conducted on geographies consisting of 509,572,105 people shows a weak negative correlation between the proportion of Natives/Alaskans and household income with householder over the age of 65 in the United States with a correlation coefficient (R) of -0.204 and weighted average of $52,081, a difference of 3.1%.
Householder Income Over 65 years Correlation Summary
| Measurement | African | Native/Alaskan |
| Minimum | $17,550 | $19,554 |
| Maximum | $77,178 | $78,193 |
| Range | $59,628 | $58,639 |
| Mean | $44,897 | $45,041 |
| Median | $45,715 | $44,466 |
| Interquartile 25% (IQ1) | $38,427 | $39,545 |
| Interquartile 75% (IQ3) | $51,942 | $51,398 |
| Interquartile Range (IQR) | $13,515 | $11,852 |
| Standard Deviation (Sample) | $12,357 | $9,551 |
| Standard Deviation (Population) | $12,253 | $9,526 |
Similar Demographics by Householder Income Over 65 years
Demographics Similar to Africans by Householder Income Over 65 years
In terms of householder income over 65 years, the demographic groups most similar to Africans are Chickasaw ($53,732, a difference of 0.040%), Iroquois ($53,737, a difference of 0.050%), Shoshone ($53,681, a difference of 0.060%), Paiute ($53,762, a difference of 0.090%), and Immigrants from Belize ($53,665, a difference of 0.090%).
| Demographics | Rating | Rank | Householder Income Over 65 years |
| Immigrants | Guatemala | 0.1 /100 | #284 | Tragic $53,950 |
| Mexicans | 0.1 /100 | #285 | Tragic $53,897 |
| Chippewa | 0.1 /100 | #286 | Tragic $53,847 |
| Immigrants | Barbados | 0.1 /100 | #287 | Tragic $53,766 |
| Paiute | 0.1 /100 | #288 | Tragic $53,762 |
| Iroquois | 0.1 /100 | #289 | Tragic $53,737 |
| Chickasaw | 0.1 /100 | #290 | Tragic $53,732 |
| Africans | 0.0 /100 | #291 | Tragic $53,711 |
| Shoshone | 0.0 /100 | #292 | Tragic $53,681 |
| Immigrants | Belize | 0.0 /100 | #293 | Tragic $53,665 |
| Senegalese | 0.0 /100 | #294 | Tragic $53,591 |
| Immigrants | Central America | 0.0 /100 | #295 | Tragic $53,420 |
| Immigrants | Somalia | 0.0 /100 | #296 | Tragic $53,333 |
| Immigrants | Latin America | 0.0 /100 | #297 | Tragic $53,265 |
| Central American Indians | 0.0 /100 | #298 | Tragic $53,232 |
Demographics Similar to Natives/Alaskans by Householder Income Over 65 years
In terms of householder income over 65 years, the demographic groups most similar to Natives/Alaskans are Immigrants from Nicaragua ($52,085, a difference of 0.010%), U.S. Virgin Islander ($52,072, a difference of 0.020%), Immigrants from the Azores ($52,121, a difference of 0.080%), Creek ($51,949, a difference of 0.25%), and Immigrants from St. Vincent and the Grenadines ($51,922, a difference of 0.30%).
| Demographics | Rating | Rank | Householder Income Over 65 years |
| Hispanics or Latinos | 0.0 /100 | #307 | Tragic $52,832 |
| Immigrants | Mexico | 0.0 /100 | #308 | Tragic $52,801 |
| Hondurans | 0.0 /100 | #309 | Tragic $52,634 |
| Sioux | 0.0 /100 | #310 | Tragic $52,509 |
| Seminole | 0.0 /100 | #311 | Tragic $52,373 |
| Immigrants | Azores | 0.0 /100 | #312 | Tragic $52,121 |
| Immigrants | Nicaragua | 0.0 /100 | #313 | Tragic $52,085 |
| Natives/Alaskans | 0.0 /100 | #314 | Tragic $52,081 |
| U.S. Virgin Islanders | 0.0 /100 | #315 | Tragic $52,072 |
| Creek | 0.0 /100 | #316 | Tragic $51,949 |
| Immigrants | St. Vincent and the Grenadines | 0.0 /100 | #317 | Tragic $51,922 |
| Haitians | 0.0 /100 | #318 | Tragic $51,912 |
| Immigrants | Honduras | 0.0 /100 | #319 | Tragic $51,888 |
| Colville | 0.0 /100 | #320 | Tragic $51,739 |
| Menominee | 0.0 /100 | #321 | Tragic $51,719 |