Yuman vs Immigrants from Belarus No Vehicles in Household
COMPARE
Yuman
Immigrants from Belarus
No Vehicles in Household
No Vehicles in Household Comparison
Yuman
Immigrants from Belarus
14.9%
NO VEHICLES IN HOUSEHOLD
0.0/ 100
METRIC RATING
300th/ 347
METRIC RANK
16.7%
NO VEHICLES IN HOUSEHOLD
0.0/ 100
METRIC RATING
318th/ 347
METRIC RANK
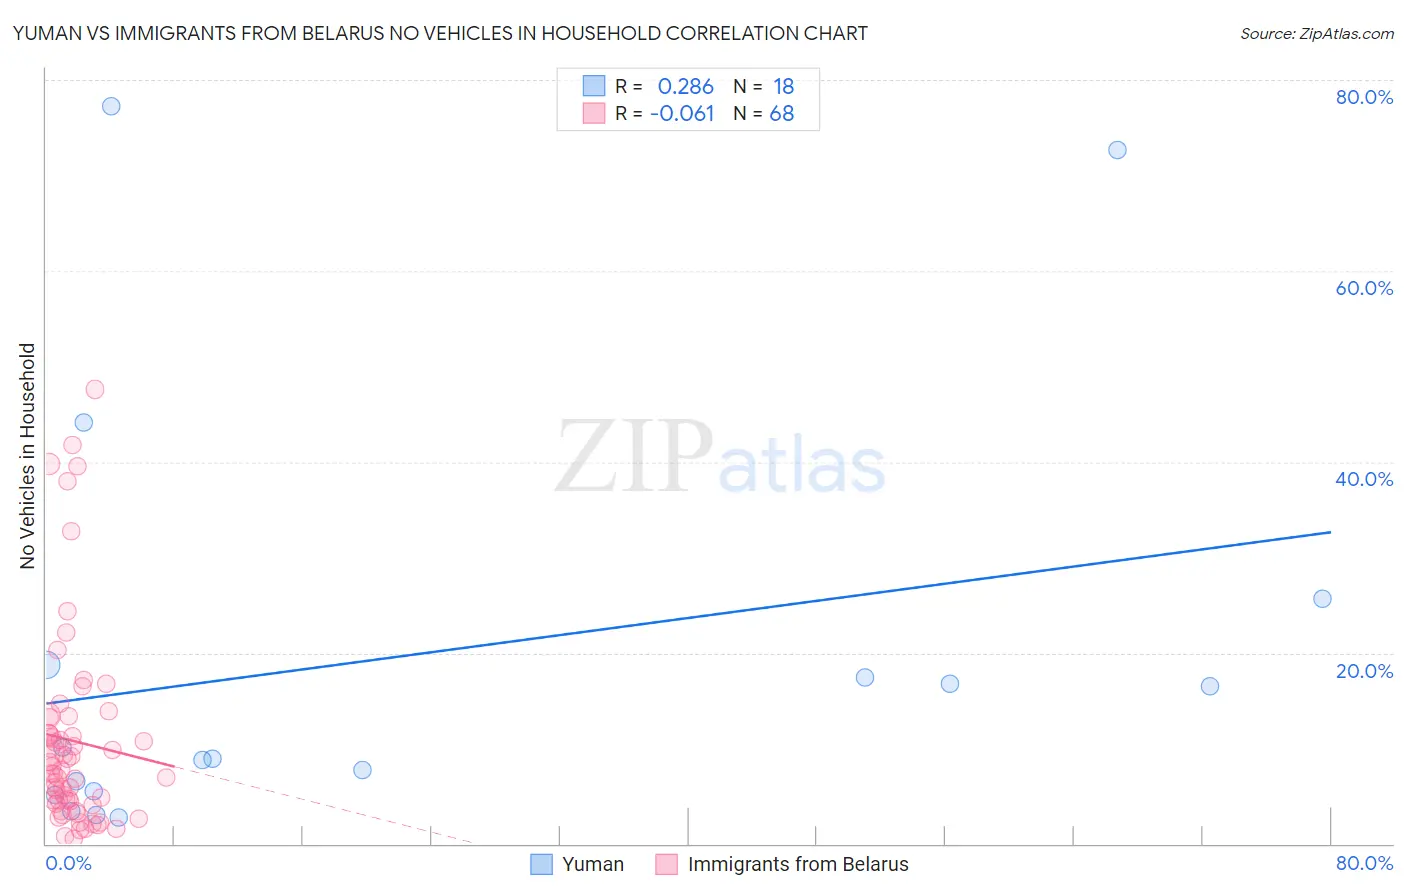
Yuman vs Immigrants from Belarus No Vehicles in Household Correlation Chart
The statistical analysis conducted on geographies consisting of 40,640,909 people shows a weak positive correlation between the proportion of Yuman and percentage of households with no vehicle available in the United States with a correlation coefficient (R) of 0.286 and weighted average of 14.9%. Similarly, the statistical analysis conducted on geographies consisting of 150,031,652 people shows a slight negative correlation between the proportion of Immigrants from Belarus and percentage of households with no vehicle available in the United States with a correlation coefficient (R) of -0.061 and weighted average of 16.7%, a difference of 12.8%.
No Vehicles in Household Correlation Summary
| Measurement | Yuman | Immigrants from Belarus |
| Minimum | 2.8% | 0.49% |
| Maximum | 77.3% | 47.6% |
| Range | 74.5% | 47.1% |
| Mean | 19.5% | 10.8% |
| Median | 9.5% | 7.5% |
| Interquartile 25% (IQ1) | 5.5% | 4.3% |
| Interquartile 75% (IQ3) | 18.8% | 12.4% |
| Interquartile Range (IQR) | 13.3% | 8.0% |
| Standard Deviation (Sample) | 22.6% | 10.5% |
| Standard Deviation (Population) | 21.9% | 10.5% |
Demographics Similar to Yuman and Immigrants from Belarus by No Vehicles in Household
In terms of no vehicles in household, the demographic groups most similar to Yuman are Immigrants from Ukraine (14.9%, a difference of 0.0%), Haitian (14.9%, a difference of 0.48%), Immigrants from Western Africa (15.0%, a difference of 1.0%), Immigrants from Greece (14.7%, a difference of 1.1%), and Immigrants from Russia (15.1%, a difference of 1.7%). Similarly, the demographic groups most similar to Immigrants from Belarus are Immigrants from Ghana (16.6%, a difference of 0.86%), Ghanaian (16.4%, a difference of 1.8%), Alaska Native (17.4%, a difference of 3.9%), Cypriot (15.7%, a difference of 6.9%), and Albanian (15.6%, a difference of 7.0%).
| Demographics | Rating | Rank | No Vehicles in Household |
| Immigrants | Greece | 0.0 /100 | #299 | Tragic 14.7% |
| Yuman | 0.0 /100 | #300 | Tragic 14.9% |
| Immigrants | Ukraine | 0.0 /100 | #301 | Tragic 14.9% |
| Haitians | 0.0 /100 | #302 | Tragic 14.9% |
| Immigrants | Western Africa | 0.0 /100 | #303 | Tragic 15.0% |
| Immigrants | Russia | 0.0 /100 | #304 | Tragic 15.1% |
| Immigrants | China | 0.0 /100 | #305 | Tragic 15.2% |
| Immigrants | Belize | 0.0 /100 | #306 | Tragic 15.4% |
| Immigrants | Haiti | 0.0 /100 | #307 | Tragic 15.4% |
| U.S. Virgin Islanders | 0.0 /100 | #308 | Tragic 15.4% |
| Puerto Ricans | 0.0 /100 | #309 | Tragic 15.5% |
| Cape Verdeans | 0.0 /100 | #310 | Tragic 15.6% |
| Immigrants | Israel | 0.0 /100 | #311 | Tragic 15.6% |
| Alaskan Athabascans | 0.0 /100 | #312 | Tragic 15.6% |
| Tohono O'odham | 0.0 /100 | #313 | Tragic 15.6% |
| Albanians | 0.0 /100 | #314 | Tragic 15.6% |
| Cypriots | 0.0 /100 | #315 | Tragic 15.7% |
| Ghanaians | 0.0 /100 | #316 | Tragic 16.4% |
| Immigrants | Ghana | 0.0 /100 | #317 | Tragic 16.6% |
| Immigrants | Belarus | 0.0 /100 | #318 | Tragic 16.7% |
| Alaska Natives | 0.0 /100 | #319 | Tragic 17.4% |