Welsh vs Comanche Associate's Degree
COMPARE
Welsh
Comanche
Associate's Degree
Associate's Degree Comparison
Welsh
Comanche
45.9%
ASSOCIATE'S DEGREE
37.9/ 100
METRIC RATING
186th/ 347
METRIC RANK
39.9%
ASSOCIATE'S DEGREE
0.1/ 100
METRIC RATING
284th/ 347
METRIC RANK
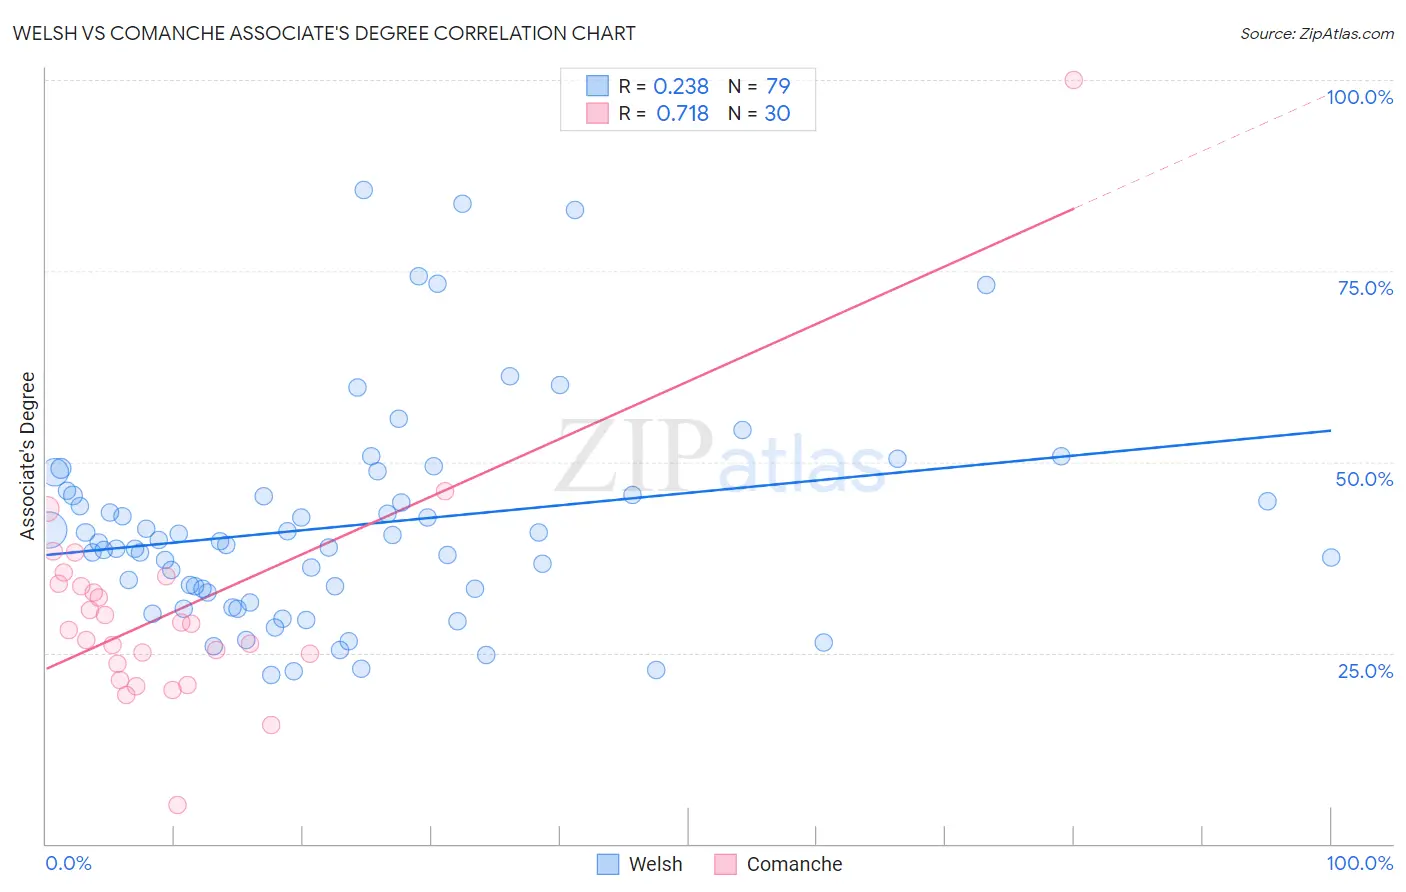
Welsh vs Comanche Associate's Degree Correlation Chart
The statistical analysis conducted on geographies consisting of 528,554,894 people shows a weak positive correlation between the proportion of Welsh and percentage of population with at least associate's degree education in the United States with a correlation coefficient (R) of 0.238 and weighted average of 45.9%. Similarly, the statistical analysis conducted on geographies consisting of 109,785,632 people shows a strong positive correlation between the proportion of Comanche and percentage of population with at least associate's degree education in the United States with a correlation coefficient (R) of 0.718 and weighted average of 39.9%, a difference of 15.1%.
Associate's Degree Correlation Summary
| Measurement | Welsh | Comanche |
| Minimum | 22.1% | 5.1% |
| Maximum | 85.6% | 100.0% |
| Range | 63.5% | 94.9% |
| Mean | 41.7% | 30.6% |
| Median | 39.4% | 28.4% |
| Interquartile 25% (IQ1) | 32.9% | 23.5% |
| Interquartile 75% (IQ3) | 45.7% | 34.0% |
| Interquartile Range (IQR) | 12.8% | 10.5% |
| Standard Deviation (Sample) | 14.0% | 15.6% |
| Standard Deviation (Population) | 13.9% | 15.3% |
Similar Demographics by Associate's Degree
Demographics Similar to Welsh by Associate's Degree
In terms of associate's degree, the demographic groups most similar to Welsh are Costa Rican (46.0%, a difference of 0.060%), Czechoslovakian (46.0%, a difference of 0.17%), Yugoslavian (46.0%, a difference of 0.19%), Swiss (46.0%, a difference of 0.20%), and Immigrants from Uruguay (45.8%, a difference of 0.20%).
| Demographics | Rating | Rank | Associate's Degree |
| Sri Lankans | 47.6 /100 | #179 | Average 46.3% |
| Bermudans | 46.4 /100 | #180 | Average 46.2% |
| Immigrants | Colombia | 41.3 /100 | #181 | Average 46.0% |
| Swiss | 40.4 /100 | #182 | Average 46.0% |
| Yugoslavians | 40.2 /100 | #183 | Average 46.0% |
| Czechoslovakians | 40.0 /100 | #184 | Average 46.0% |
| Costa Ricans | 38.6 /100 | #185 | Fair 46.0% |
| Welsh | 37.9 /100 | #186 | Fair 45.9% |
| Immigrants | Uruguay | 35.5 /100 | #187 | Fair 45.8% |
| Ghanaians | 35.5 /100 | #188 | Fair 45.8% |
| Immigrants | Oceania | 34.7 /100 | #189 | Fair 45.8% |
| Vietnamese | 34.0 /100 | #190 | Fair 45.8% |
| Koreans | 33.8 /100 | #191 | Fair 45.8% |
| Celtics | 33.3 /100 | #192 | Fair 45.8% |
| Immigrants | Cameroon | 31.0 /100 | #193 | Fair 45.7% |
Demographics Similar to Comanche by Associate's Degree
In terms of associate's degree, the demographic groups most similar to Comanche are Immigrants from Belize (39.9%, a difference of 0.10%), Haitian (40.0%, a difference of 0.12%), Bangladeshi (40.0%, a difference of 0.26%), Immigrants from Caribbean (39.7%, a difference of 0.44%), and Immigrants from Portugal (40.1%, a difference of 0.58%).
| Demographics | Rating | Rank | Associate's Degree |
| Blackfeet | 0.1 /100 | #277 | Tragic 40.3% |
| Ottawa | 0.1 /100 | #278 | Tragic 40.3% |
| Immigrants | Nicaragua | 0.1 /100 | #279 | Tragic 40.3% |
| Immigrants | Micronesia | 0.1 /100 | #280 | Tragic 40.2% |
| Immigrants | Portugal | 0.1 /100 | #281 | Tragic 40.1% |
| Bangladeshis | 0.1 /100 | #282 | Tragic 40.0% |
| Haitians | 0.1 /100 | #283 | Tragic 40.0% |
| Comanche | 0.1 /100 | #284 | Tragic 39.9% |
| Immigrants | Belize | 0.1 /100 | #285 | Tragic 39.9% |
| Immigrants | Caribbean | 0.0 /100 | #286 | Tragic 39.7% |
| Aleuts | 0.0 /100 | #287 | Tragic 39.6% |
| Immigrants | Cuba | 0.0 /100 | #288 | Tragic 39.5% |
| Central Americans | 0.0 /100 | #289 | Tragic 39.4% |
| Immigrants | Haiti | 0.0 /100 | #290 | Tragic 39.3% |
| Dominicans | 0.0 /100 | #291 | Tragic 39.3% |