Macedonian vs Comanche Associate's Degree
COMPARE
Macedonian
Comanche
Associate's Degree
Associate's Degree Comparison
Macedonians
Comanche
49.6%
ASSOCIATE'S DEGREE
97.8/ 100
METRIC RATING
99th/ 347
METRIC RANK
39.9%
ASSOCIATE'S DEGREE
0.1/ 100
METRIC RATING
284th/ 347
METRIC RANK
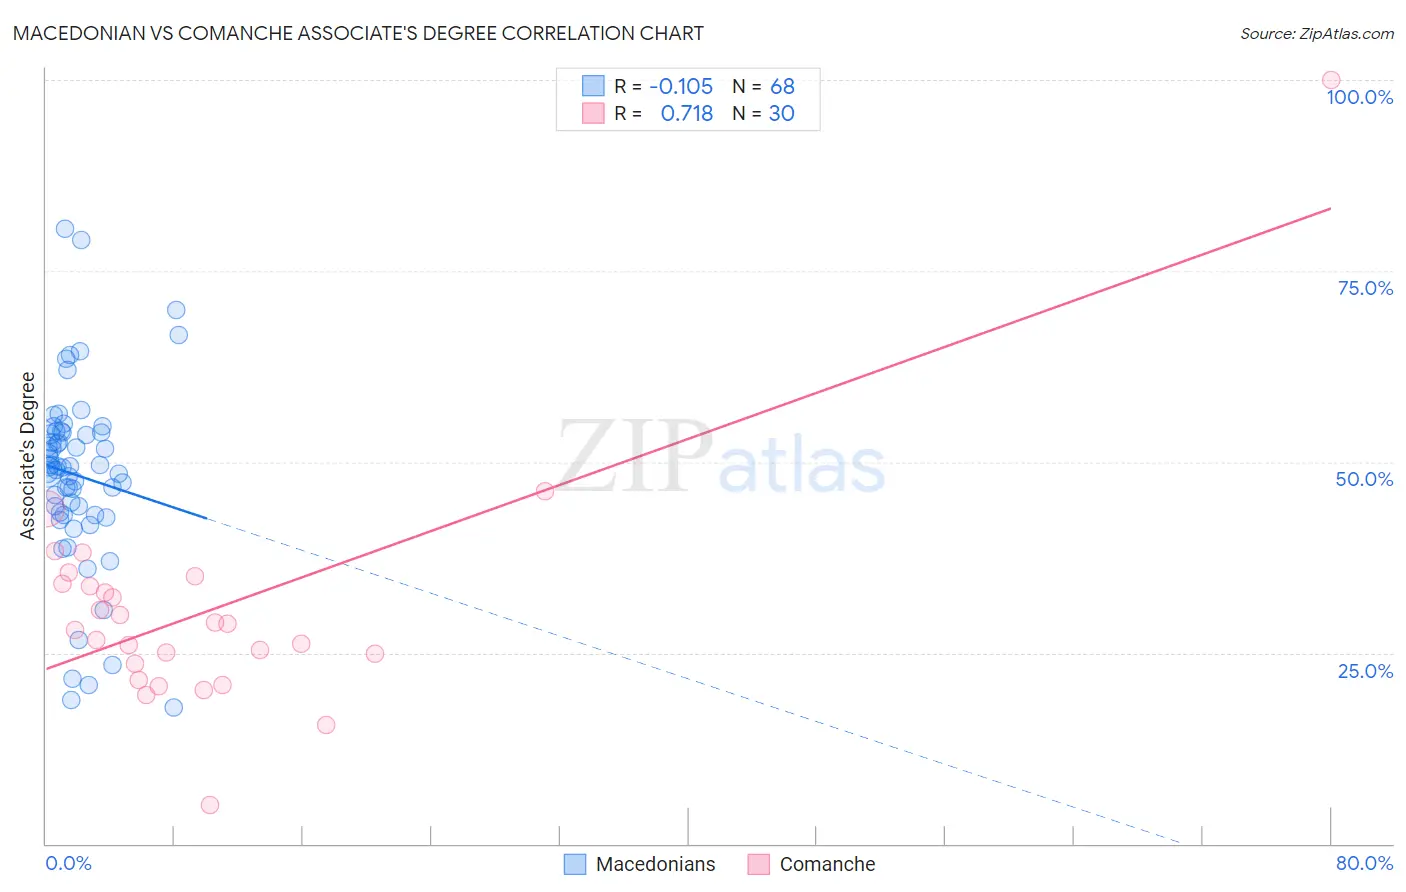
Macedonian vs Comanche Associate's Degree Correlation Chart
The statistical analysis conducted on geographies consisting of 132,656,097 people shows a poor negative correlation between the proportion of Macedonians and percentage of population with at least associate's degree education in the United States with a correlation coefficient (R) of -0.105 and weighted average of 49.6%. Similarly, the statistical analysis conducted on geographies consisting of 109,785,632 people shows a strong positive correlation between the proportion of Comanche and percentage of population with at least associate's degree education in the United States with a correlation coefficient (R) of 0.718 and weighted average of 39.9%, a difference of 24.4%.
Associate's Degree Correlation Summary
| Measurement | Macedonian | Comanche |
| Minimum | 17.8% | 5.1% |
| Maximum | 80.6% | 100.0% |
| Range | 62.7% | 94.9% |
| Mean | 48.2% | 30.6% |
| Median | 49.4% | 28.4% |
| Interquartile 25% (IQ1) | 43.2% | 23.5% |
| Interquartile 75% (IQ3) | 53.9% | 34.0% |
| Interquartile Range (IQR) | 10.6% | 10.5% |
| Standard Deviation (Sample) | 12.1% | 15.6% |
| Standard Deviation (Population) | 12.0% | 15.3% |
Similar Demographics by Associate's Degree
Demographics Similar to Macedonians by Associate's Degree
In terms of associate's degree, the demographic groups most similar to Macedonians are Immigrants from Northern Africa (49.7%, a difference of 0.070%), Romanian (49.7%, a difference of 0.16%), Immigrants from Ukraine (49.7%, a difference of 0.16%), Immigrants from England (49.7%, a difference of 0.18%), and Immigrants from Nepal (49.5%, a difference of 0.22%).
| Demographics | Rating | Rank | Associate's Degree |
| Immigrants | North America | 98.7 /100 | #92 | Exceptional 50.1% |
| Immigrants | Brazil | 98.5 /100 | #93 | Exceptional 50.0% |
| Laotians | 98.4 /100 | #94 | Exceptional 49.9% |
| Immigrants | England | 98.0 /100 | #95 | Exceptional 49.7% |
| Romanians | 98.0 /100 | #96 | Exceptional 49.7% |
| Immigrants | Ukraine | 98.0 /100 | #97 | Exceptional 49.7% |
| Immigrants | Northern Africa | 97.9 /100 | #98 | Exceptional 49.7% |
| Macedonians | 97.8 /100 | #99 | Exceptional 49.6% |
| Immigrants | Nepal | 97.5 /100 | #100 | Exceptional 49.5% |
| Northern Europeans | 97.3 /100 | #101 | Exceptional 49.5% |
| Chileans | 97.3 /100 | #102 | Exceptional 49.4% |
| Ukrainians | 97.1 /100 | #103 | Exceptional 49.4% |
| Venezuelans | 97.0 /100 | #104 | Exceptional 49.4% |
| Croatians | 96.8 /100 | #105 | Exceptional 49.3% |
| Immigrants | Italy | 96.7 /100 | #106 | Exceptional 49.3% |
Demographics Similar to Comanche by Associate's Degree
In terms of associate's degree, the demographic groups most similar to Comanche are Immigrants from Belize (39.9%, a difference of 0.10%), Haitian (40.0%, a difference of 0.12%), Bangladeshi (40.0%, a difference of 0.26%), Immigrants from Caribbean (39.7%, a difference of 0.44%), and Immigrants from Portugal (40.1%, a difference of 0.58%).
| Demographics | Rating | Rank | Associate's Degree |
| Blackfeet | 0.1 /100 | #277 | Tragic 40.3% |
| Ottawa | 0.1 /100 | #278 | Tragic 40.3% |
| Immigrants | Nicaragua | 0.1 /100 | #279 | Tragic 40.3% |
| Immigrants | Micronesia | 0.1 /100 | #280 | Tragic 40.2% |
| Immigrants | Portugal | 0.1 /100 | #281 | Tragic 40.1% |
| Bangladeshis | 0.1 /100 | #282 | Tragic 40.0% |
| Haitians | 0.1 /100 | #283 | Tragic 40.0% |
| Comanche | 0.1 /100 | #284 | Tragic 39.9% |
| Immigrants | Belize | 0.1 /100 | #285 | Tragic 39.9% |
| Immigrants | Caribbean | 0.0 /100 | #286 | Tragic 39.7% |
| Aleuts | 0.0 /100 | #287 | Tragic 39.6% |
| Immigrants | Cuba | 0.0 /100 | #288 | Tragic 39.5% |
| Central Americans | 0.0 /100 | #289 | Tragic 39.4% |
| Immigrants | Haiti | 0.0 /100 | #290 | Tragic 39.3% |
| Dominicans | 0.0 /100 | #291 | Tragic 39.3% |