Immigrants from Philippines vs Comanche Associate's Degree
COMPARE
Immigrants from Philippines
Comanche
Associate's Degree
Associate's Degree Comparison
Immigrants from Philippines
Comanche
45.0%
ASSOCIATE'S DEGREE
16.7/ 100
METRIC RATING
210th/ 347
METRIC RANK
39.9%
ASSOCIATE'S DEGREE
0.1/ 100
METRIC RATING
284th/ 347
METRIC RANK
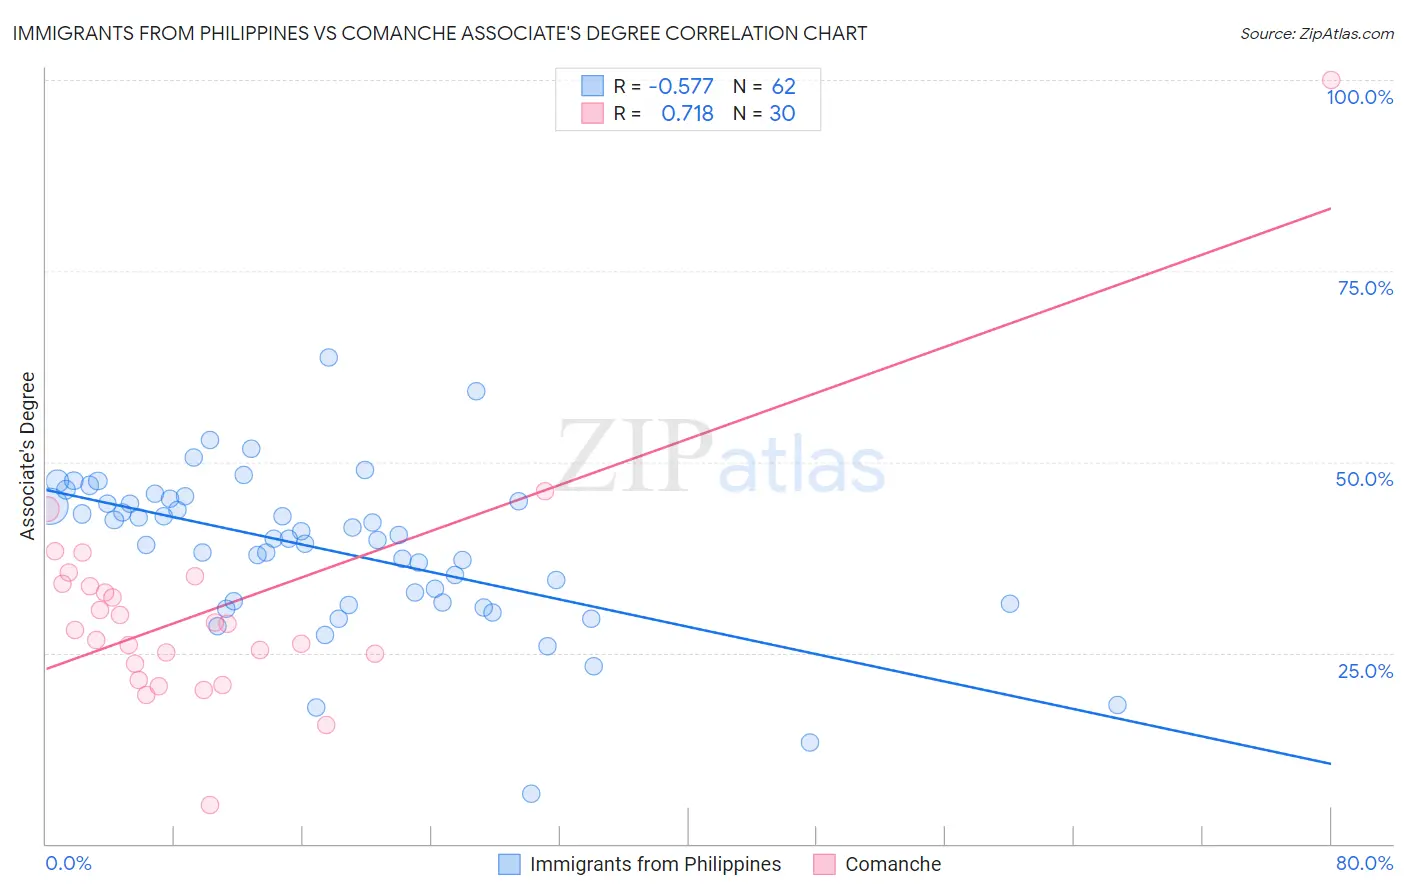
Immigrants from Philippines vs Comanche Associate's Degree Correlation Chart
The statistical analysis conducted on geographies consisting of 471,293,410 people shows a substantial negative correlation between the proportion of Immigrants from Philippines and percentage of population with at least associate's degree education in the United States with a correlation coefficient (R) of -0.577 and weighted average of 45.0%. Similarly, the statistical analysis conducted on geographies consisting of 109,785,632 people shows a strong positive correlation between the proportion of Comanche and percentage of population with at least associate's degree education in the United States with a correlation coefficient (R) of 0.718 and weighted average of 39.9%, a difference of 12.6%.
Associate's Degree Correlation Summary
| Measurement | Immigrants from Philippines | Comanche |
| Minimum | 6.5% | 5.1% |
| Maximum | 63.7% | 100.0% |
| Range | 57.2% | 94.9% |
| Mean | 38.5% | 30.6% |
| Median | 39.9% | 28.4% |
| Interquartile 25% (IQ1) | 31.5% | 23.5% |
| Interquartile 75% (IQ3) | 44.8% | 34.0% |
| Interquartile Range (IQR) | 13.3% | 10.5% |
| Standard Deviation (Sample) | 10.2% | 15.6% |
| Standard Deviation (Population) | 10.2% | 15.3% |
Similar Demographics by Associate's Degree
Demographics Similar to Immigrants from Philippines by Associate's Degree
In terms of associate's degree, the demographic groups most similar to Immigrants from Philippines are Immigrants from Costa Rica (45.0%, a difference of 0.010%), Immigrants from Zaire (45.0%, a difference of 0.010%), Dutch (45.0%, a difference of 0.12%), Panamanian (45.1%, a difference of 0.22%), and French Canadian (44.9%, a difference of 0.24%).
| Demographics | Rating | Rank | Associate's Degree |
| Immigrants | South Eastern Asia | 20.2 /100 | #203 | Fair 45.2% |
| Nigerians | 19.1 /100 | #204 | Poor 45.1% |
| Immigrants | Thailand | 18.9 /100 | #205 | Poor 45.1% |
| German Russians | 18.9 /100 | #206 | Poor 45.1% |
| Panamanians | 18.4 /100 | #207 | Poor 45.1% |
| Dutch | 17.6 /100 | #208 | Poor 45.0% |
| Immigrants | Costa Rica | 16.7 /100 | #209 | Poor 45.0% |
| Immigrants | Philippines | 16.7 /100 | #210 | Poor 45.0% |
| Immigrants | Zaire | 16.6 /100 | #211 | Poor 45.0% |
| French Canadians | 15.0 /100 | #212 | Poor 44.9% |
| Immigrants | Ghana | 14.2 /100 | #213 | Poor 44.8% |
| Immigrants | Middle Africa | 12.7 /100 | #214 | Poor 44.7% |
| Immigrants | Panama | 12.4 /100 | #215 | Poor 44.7% |
| Immigrants | Nigeria | 11.4 /100 | #216 | Poor 44.6% |
| Immigrants | Immigrants | 10.5 /100 | #217 | Poor 44.5% |
Demographics Similar to Comanche by Associate's Degree
In terms of associate's degree, the demographic groups most similar to Comanche are Immigrants from Belize (39.9%, a difference of 0.10%), Haitian (40.0%, a difference of 0.12%), Bangladeshi (40.0%, a difference of 0.26%), Immigrants from Caribbean (39.7%, a difference of 0.44%), and Immigrants from Portugal (40.1%, a difference of 0.58%).
| Demographics | Rating | Rank | Associate's Degree |
| Blackfeet | 0.1 /100 | #277 | Tragic 40.3% |
| Ottawa | 0.1 /100 | #278 | Tragic 40.3% |
| Immigrants | Nicaragua | 0.1 /100 | #279 | Tragic 40.3% |
| Immigrants | Micronesia | 0.1 /100 | #280 | Tragic 40.2% |
| Immigrants | Portugal | 0.1 /100 | #281 | Tragic 40.1% |
| Bangladeshis | 0.1 /100 | #282 | Tragic 40.0% |
| Haitians | 0.1 /100 | #283 | Tragic 40.0% |
| Comanche | 0.1 /100 | #284 | Tragic 39.9% |
| Immigrants | Belize | 0.1 /100 | #285 | Tragic 39.9% |
| Immigrants | Caribbean | 0.0 /100 | #286 | Tragic 39.7% |
| Aleuts | 0.0 /100 | #287 | Tragic 39.6% |
| Immigrants | Cuba | 0.0 /100 | #288 | Tragic 39.5% |
| Central Americans | 0.0 /100 | #289 | Tragic 39.4% |
| Immigrants | Haiti | 0.0 /100 | #290 | Tragic 39.3% |
| Dominicans | 0.0 /100 | #291 | Tragic 39.3% |