Welsh vs Immigrants from Burma/Myanmar Associate's Degree
COMPARE
Welsh
Immigrants from Burma/Myanmar
Associate's Degree
Associate's Degree Comparison
Welsh
Immigrants from Burma/Myanmar
45.9%
ASSOCIATE'S DEGREE
37.9/ 100
METRIC RATING
186th/ 347
METRIC RANK
43.7%
ASSOCIATE'S DEGREE
4.3/ 100
METRIC RATING
226th/ 347
METRIC RANK
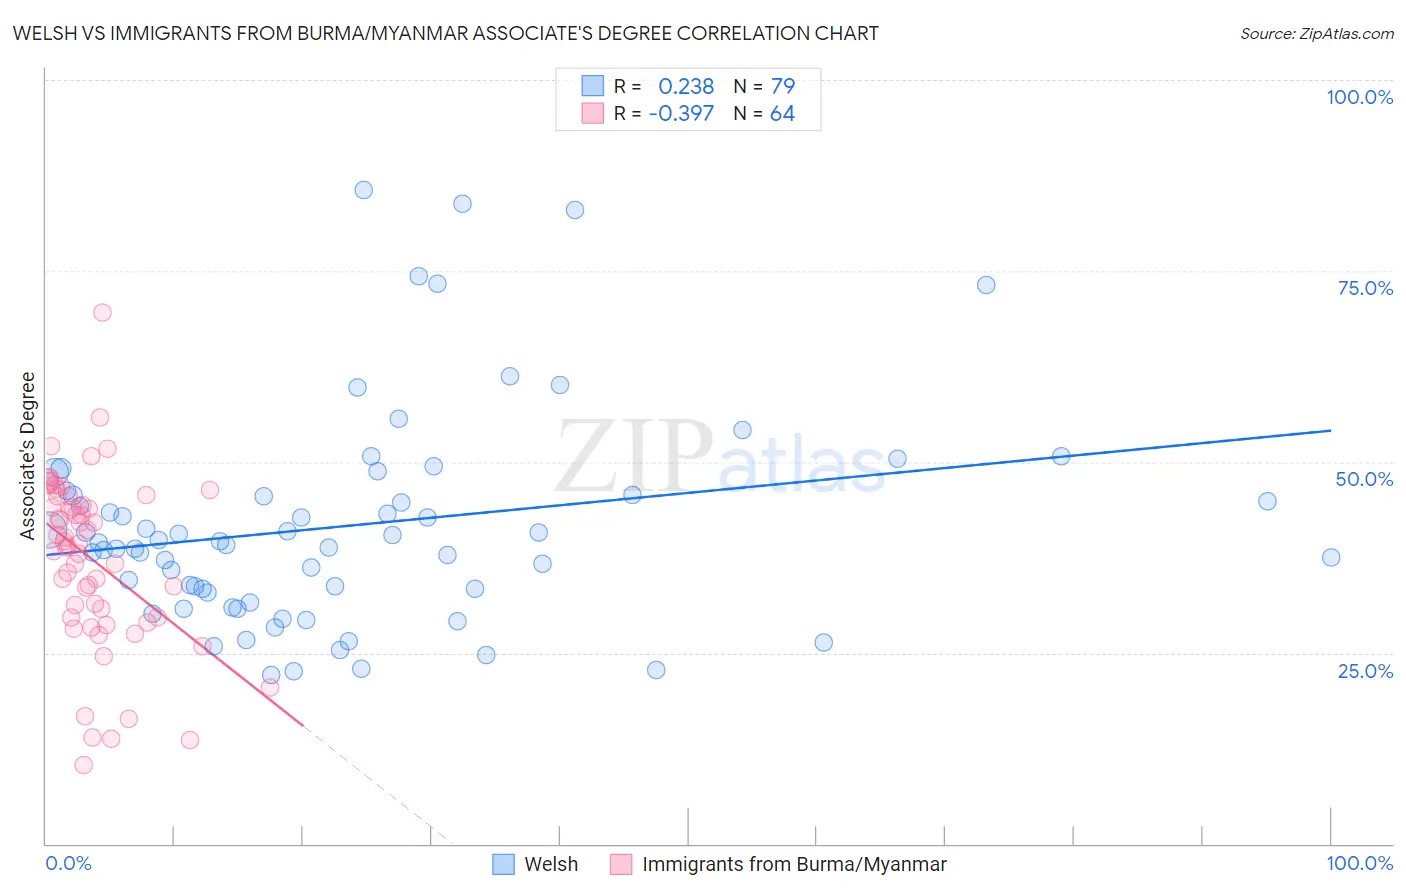
Welsh vs Immigrants from Burma/Myanmar Associate's Degree Correlation Chart
The statistical analysis conducted on geographies consisting of 528,554,894 people shows a weak positive correlation between the proportion of Welsh and percentage of population with at least associate's degree education in the United States with a correlation coefficient (R) of 0.238 and weighted average of 45.9%. Similarly, the statistical analysis conducted on geographies consisting of 172,341,560 people shows a mild negative correlation between the proportion of Immigrants from Burma/Myanmar and percentage of population with at least associate's degree education in the United States with a correlation coefficient (R) of -0.397 and weighted average of 43.7%, a difference of 5.2%.
Associate's Degree Correlation Summary
| Measurement | Welsh | Immigrants from Burma/Myanmar |
| Minimum | 22.1% | 10.2% |
| Maximum | 85.6% | 69.5% |
| Range | 63.5% | 59.3% |
| Mean | 41.7% | 37.2% |
| Median | 39.4% | 39.1% |
| Interquartile 25% (IQ1) | 32.9% | 29.7% |
| Interquartile 75% (IQ3) | 45.7% | 44.9% |
| Interquartile Range (IQR) | 12.8% | 15.2% |
| Standard Deviation (Sample) | 14.0% | 11.3% |
| Standard Deviation (Population) | 13.9% | 11.2% |
Similar Demographics by Associate's Degree
Demographics Similar to Welsh by Associate's Degree
In terms of associate's degree, the demographic groups most similar to Welsh are Costa Rican (46.0%, a difference of 0.060%), Czechoslovakian (46.0%, a difference of 0.17%), Yugoslavian (46.0%, a difference of 0.19%), Swiss (46.0%, a difference of 0.20%), and Immigrants from Uruguay (45.8%, a difference of 0.20%).
| Demographics | Rating | Rank | Associate's Degree |
| Sri Lankans | 47.6 /100 | #179 | Average 46.3% |
| Bermudans | 46.4 /100 | #180 | Average 46.2% |
| Immigrants | Colombia | 41.3 /100 | #181 | Average 46.0% |
| Swiss | 40.4 /100 | #182 | Average 46.0% |
| Yugoslavians | 40.2 /100 | #183 | Average 46.0% |
| Czechoslovakians | 40.0 /100 | #184 | Average 46.0% |
| Costa Ricans | 38.6 /100 | #185 | Fair 46.0% |
| Welsh | 37.9 /100 | #186 | Fair 45.9% |
| Immigrants | Uruguay | 35.5 /100 | #187 | Fair 45.8% |
| Ghanaians | 35.5 /100 | #188 | Fair 45.8% |
| Immigrants | Oceania | 34.7 /100 | #189 | Fair 45.8% |
| Vietnamese | 34.0 /100 | #190 | Fair 45.8% |
| Koreans | 33.8 /100 | #191 | Fair 45.8% |
| Celtics | 33.3 /100 | #192 | Fair 45.8% |
| Immigrants | Cameroon | 31.0 /100 | #193 | Fair 45.7% |
Demographics Similar to Immigrants from Burma/Myanmar by Associate's Degree
In terms of associate's degree, the demographic groups most similar to Immigrants from Burma/Myanmar are Trinidadian and Tobagonian (43.6%, a difference of 0.17%), Guamanian/Chamorro (43.8%, a difference of 0.22%), West Indian (43.8%, a difference of 0.37%), Subsaharan African (43.9%, a difference of 0.51%), and Barbadian (43.9%, a difference of 0.61%).
| Demographics | Rating | Rank | Associate's Degree |
| Whites/Caucasians | 7.5 /100 | #219 | Tragic 44.2% |
| Portuguese | 7.2 /100 | #220 | Tragic 44.1% |
| Immigrants | Western Africa | 6.6 /100 | #221 | Tragic 44.1% |
| Barbadians | 5.8 /100 | #222 | Tragic 43.9% |
| Sub-Saharan Africans | 5.5 /100 | #223 | Tragic 43.9% |
| West Indians | 5.2 /100 | #224 | Tragic 43.8% |
| Guamanians/Chamorros | 4.8 /100 | #225 | Tragic 43.8% |
| Immigrants | Burma/Myanmar | 4.3 /100 | #226 | Tragic 43.7% |
| Trinidadians and Tobagonians | 4.0 /100 | #227 | Tragic 43.6% |
| Hmong | 3.2 /100 | #228 | Tragic 43.4% |
| Immigrants | Trinidad and Tobago | 3.0 /100 | #229 | Tragic 43.3% |
| Immigrants | Barbados | 2.9 /100 | #230 | Tragic 43.3% |
| Liberians | 2.9 /100 | #231 | Tragic 43.3% |
| Native Hawaiians | 2.3 /100 | #232 | Tragic 43.1% |
| Tongans | 2.2 /100 | #233 | Tragic 43.0% |