Welsh vs Immigrants from Eritrea Associate's Degree
COMPARE
Welsh
Immigrants from Eritrea
Associate's Degree
Associate's Degree Comparison
Welsh
Immigrants from Eritrea
45.9%
ASSOCIATE'S DEGREE
37.9/ 100
METRIC RATING
186th/ 347
METRIC RANK
48.1%
ASSOCIATE'S DEGREE
87.8/ 100
METRIC RATING
137th/ 347
METRIC RANK
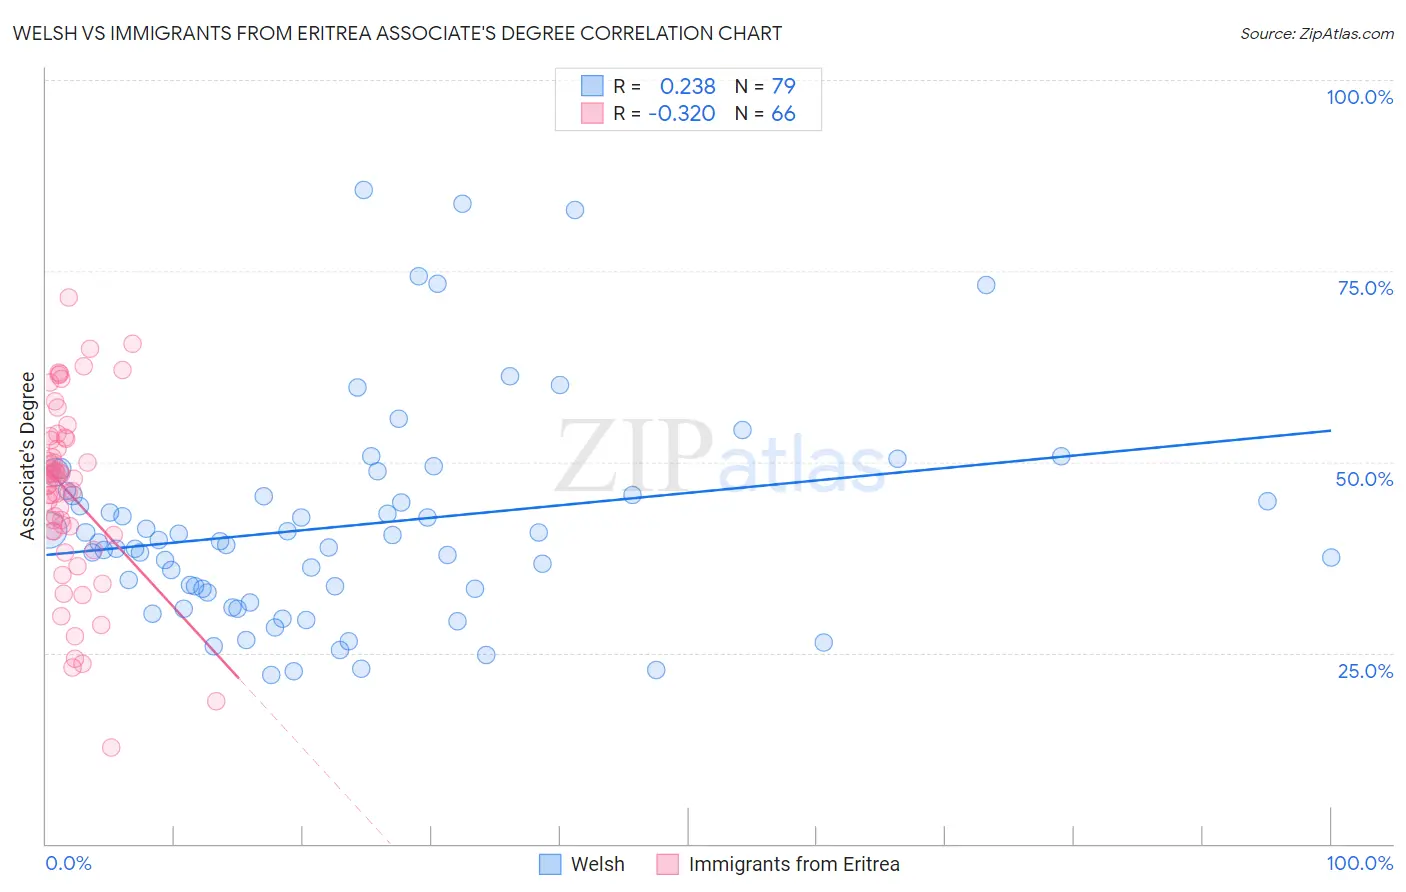
Welsh vs Immigrants from Eritrea Associate's Degree Correlation Chart
The statistical analysis conducted on geographies consisting of 528,554,894 people shows a weak positive correlation between the proportion of Welsh and percentage of population with at least associate's degree education in the United States with a correlation coefficient (R) of 0.238 and weighted average of 45.9%. Similarly, the statistical analysis conducted on geographies consisting of 104,852,788 people shows a mild negative correlation between the proportion of Immigrants from Eritrea and percentage of population with at least associate's degree education in the United States with a correlation coefficient (R) of -0.320 and weighted average of 48.1%, a difference of 4.6%.
Associate's Degree Correlation Summary
| Measurement | Welsh | Immigrants from Eritrea |
| Minimum | 22.1% | 12.6% |
| Maximum | 85.6% | 71.5% |
| Range | 63.5% | 58.9% |
| Mean | 41.7% | 46.0% |
| Median | 39.4% | 47.9% |
| Interquartile 25% (IQ1) | 32.9% | 40.9% |
| Interquartile 75% (IQ3) | 45.7% | 53.1% |
| Interquartile Range (IQR) | 12.8% | 12.2% |
| Standard Deviation (Sample) | 14.0% | 11.9% |
| Standard Deviation (Population) | 13.9% | 11.8% |
Similar Demographics by Associate's Degree
Demographics Similar to Welsh by Associate's Degree
In terms of associate's degree, the demographic groups most similar to Welsh are Costa Rican (46.0%, a difference of 0.060%), Czechoslovakian (46.0%, a difference of 0.17%), Yugoslavian (46.0%, a difference of 0.19%), Swiss (46.0%, a difference of 0.20%), and Immigrants from Uruguay (45.8%, a difference of 0.20%).
| Demographics | Rating | Rank | Associate's Degree |
| Sri Lankans | 47.6 /100 | #179 | Average 46.3% |
| Bermudans | 46.4 /100 | #180 | Average 46.2% |
| Immigrants | Colombia | 41.3 /100 | #181 | Average 46.0% |
| Swiss | 40.4 /100 | #182 | Average 46.0% |
| Yugoslavians | 40.2 /100 | #183 | Average 46.0% |
| Czechoslovakians | 40.0 /100 | #184 | Average 46.0% |
| Costa Ricans | 38.6 /100 | #185 | Fair 46.0% |
| Welsh | 37.9 /100 | #186 | Fair 45.9% |
| Immigrants | Uruguay | 35.5 /100 | #187 | Fair 45.8% |
| Ghanaians | 35.5 /100 | #188 | Fair 45.8% |
| Immigrants | Oceania | 34.7 /100 | #189 | Fair 45.8% |
| Vietnamese | 34.0 /100 | #190 | Fair 45.8% |
| Koreans | 33.8 /100 | #191 | Fair 45.8% |
| Celtics | 33.3 /100 | #192 | Fair 45.8% |
| Immigrants | Cameroon | 31.0 /100 | #193 | Fair 45.7% |
Demographics Similar to Immigrants from Eritrea by Associate's Degree
In terms of associate's degree, the demographic groups most similar to Immigrants from Eritrea are Pakistani (48.1%, a difference of 0.040%), Polish (48.0%, a difference of 0.070%), European (48.2%, a difference of 0.22%), Moroccan (48.2%, a difference of 0.28%), and Assyrian/Chaldean/Syriac (48.2%, a difference of 0.30%).
| Demographics | Rating | Rank | Associate's Degree |
| Immigrants | Jordan | 91.2 /100 | #130 | Exceptional 48.4% |
| Icelanders | 90.8 /100 | #131 | Exceptional 48.3% |
| Immigrants | Albania | 89.9 /100 | #132 | Excellent 48.2% |
| Assyrians/Chaldeans/Syriacs | 89.4 /100 | #133 | Excellent 48.2% |
| Moroccans | 89.3 /100 | #134 | Excellent 48.2% |
| Europeans | 89.0 /100 | #135 | Excellent 48.2% |
| Pakistanis | 88.0 /100 | #136 | Excellent 48.1% |
| Immigrants | Eritrea | 87.8 /100 | #137 | Excellent 48.1% |
| Poles | 87.3 /100 | #138 | Excellent 48.0% |
| Slovenes | 85.1 /100 | #139 | Excellent 47.9% |
| Immigrants | Southern Europe | 84.4 /100 | #140 | Excellent 47.8% |
| Taiwanese | 83.3 /100 | #141 | Excellent 47.7% |
| Sierra Leoneans | 82.9 /100 | #142 | Excellent 47.7% |
| Norwegians | 81.0 /100 | #143 | Excellent 47.6% |
| Slavs | 80.5 /100 | #144 | Excellent 47.6% |