Welsh vs Comanche No Schooling Completed
COMPARE
Welsh
Comanche
No Schooling Completed
No Schooling Completed Comparison
Welsh
Comanche
1.5%
NO SCHOOLING COMPLETED
100.0/ 100
METRIC RATING
20th/ 347
METRIC RANK
2.1%
NO SCHOOLING COMPLETED
60.7/ 100
METRIC RATING
164th/ 347
METRIC RANK
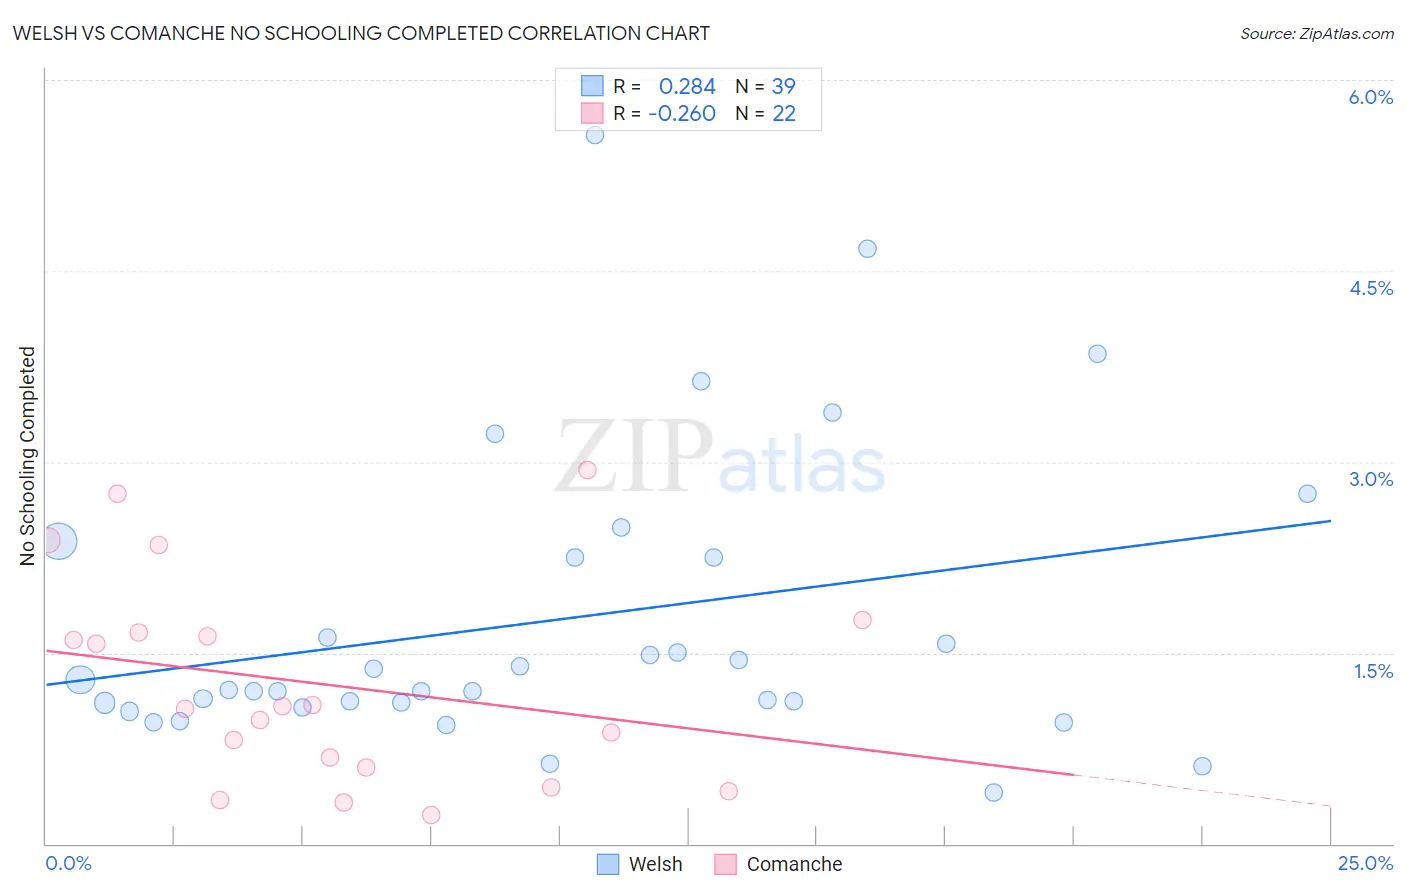
Welsh vs Comanche No Schooling Completed Correlation Chart
The statistical analysis conducted on geographies consisting of 514,712,087 people shows a weak positive correlation between the proportion of Welsh and percentage of population with no schooling in the United States with a correlation coefficient (R) of 0.284 and weighted average of 1.5%. Similarly, the statistical analysis conducted on geographies consisting of 109,390,428 people shows a weak negative correlation between the proportion of Comanche and percentage of population with no schooling in the United States with a correlation coefficient (R) of -0.260 and weighted average of 2.1%, a difference of 40.4%.
No Schooling Completed Correlation Summary
| Measurement | Welsh | Comanche |
| Minimum | 0.40% | 0.23% |
| Maximum | 5.6% | 2.9% |
| Range | 5.2% | 2.7% |
| Mean | 1.8% | 1.3% |
| Median | 1.2% | 1.1% |
| Interquartile 25% (IQ1) | 1.1% | 0.59% |
| Interquartile 75% (IQ3) | 2.2% | 1.7% |
| Interquartile Range (IQR) | 1.1% | 1.1% |
| Standard Deviation (Sample) | 1.2% | 0.81% |
| Standard Deviation (Population) | 1.1% | 0.79% |
Similar Demographics by No Schooling Completed
Demographics Similar to Welsh by No Schooling Completed
In terms of no schooling completed, the demographic groups most similar to Welsh are Alaskan Athabascan (1.5%, a difference of 0.13%), Danish (1.5%, a difference of 0.23%), Chinese (1.5%, a difference of 0.37%), Alaska Native (1.5%, a difference of 0.46%), and Croatian (1.5%, a difference of 0.53%).
| Demographics | Rating | Rank | No Schooling Completed |
| Poles | 100.0 /100 | #13 | Exceptional 1.4% |
| Scotch-Irish | 100.0 /100 | #14 | Exceptional 1.5% |
| Tlingit-Haida | 100.0 /100 | #15 | Exceptional 1.5% |
| Finns | 100.0 /100 | #16 | Exceptional 1.5% |
| Croatians | 100.0 /100 | #17 | Exceptional 1.5% |
| Danes | 100.0 /100 | #18 | Exceptional 1.5% |
| Alaskan Athabascans | 100.0 /100 | #19 | Exceptional 1.5% |
| Welsh | 100.0 /100 | #20 | Exceptional 1.5% |
| Chinese | 100.0 /100 | #21 | Exceptional 1.5% |
| Alaska Natives | 100.0 /100 | #22 | Exceptional 1.5% |
| Europeans | 100.0 /100 | #23 | Exceptional 1.5% |
| Pennsylvania Germans | 100.0 /100 | #24 | Exceptional 1.5% |
| French | 100.0 /100 | #25 | Exceptional 1.5% |
| Czechs | 100.0 /100 | #26 | Exceptional 1.5% |
| Scandinavians | 100.0 /100 | #27 | Exceptional 1.5% |
Demographics Similar to Comanche by No Schooling Completed
In terms of no schooling completed, the demographic groups most similar to Comanche are Brazilian (2.1%, a difference of 0.060%), Dutch West Indian (2.1%, a difference of 0.11%), Egyptian (2.1%, a difference of 0.21%), Albanian (2.1%, a difference of 0.22%), and Cheyenne (2.1%, a difference of 0.29%).
| Demographics | Rating | Rank | No Schooling Completed |
| Immigrants | Sri Lanka | 67.0 /100 | #157 | Good 2.0% |
| Immigrants | Korea | 66.7 /100 | #158 | Good 2.0% |
| Immigrants | Spain | 66.4 /100 | #159 | Good 2.0% |
| Kenyans | 65.7 /100 | #160 | Good 2.0% |
| Ugandans | 64.6 /100 | #161 | Good 2.0% |
| Immigrants | Brazil | 63.8 /100 | #162 | Good 2.1% |
| Albanians | 62.2 /100 | #163 | Good 2.1% |
| Comanche | 60.7 /100 | #164 | Good 2.1% |
| Brazilians | 60.2 /100 | #165 | Good 2.1% |
| Dutch West Indians | 59.9 /100 | #166 | Average 2.1% |
| Egyptians | 59.2 /100 | #167 | Average 2.1% |
| Cheyenne | 58.6 /100 | #168 | Average 2.1% |
| Apache | 56.7 /100 | #169 | Average 2.1% |
| Argentineans | 56.0 /100 | #170 | Average 2.1% |
| Immigrants | Poland | 55.2 /100 | #171 | Average 2.1% |