Immigrants from Fiji vs Comanche Associate's Degree
COMPARE
Immigrants from Fiji
Comanche
Associate's Degree
Associate's Degree Comparison
Immigrants from Fiji
Comanche
42.2%
ASSOCIATE'S DEGREE
0.8/ 100
METRIC RATING
247th/ 347
METRIC RANK
39.9%
ASSOCIATE'S DEGREE
0.1/ 100
METRIC RATING
284th/ 347
METRIC RANK
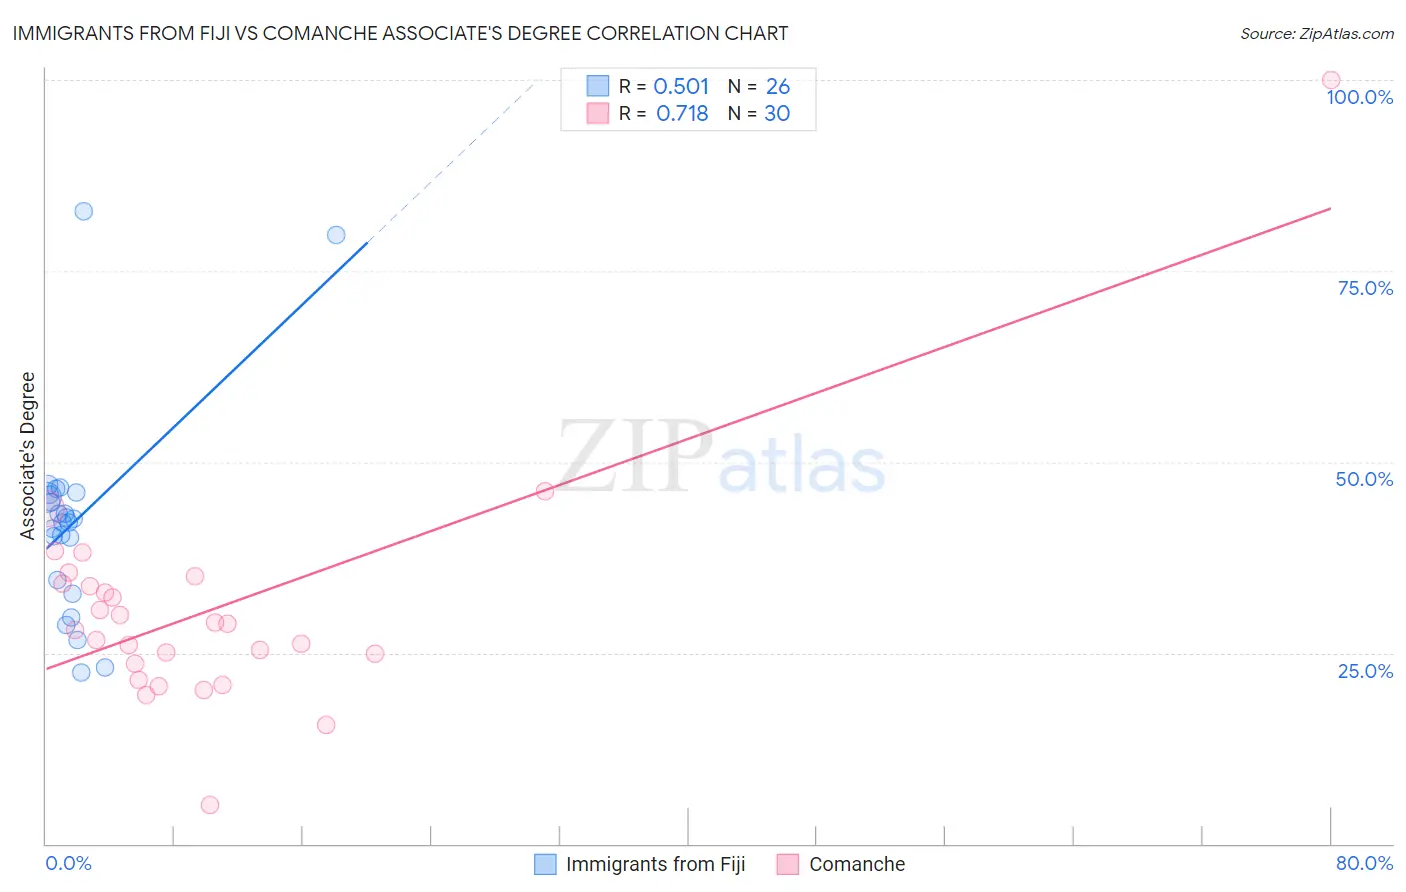
Immigrants from Fiji vs Comanche Associate's Degree Correlation Chart
The statistical analysis conducted on geographies consisting of 93,756,204 people shows a substantial positive correlation between the proportion of Immigrants from Fiji and percentage of population with at least associate's degree education in the United States with a correlation coefficient (R) of 0.501 and weighted average of 42.2%. Similarly, the statistical analysis conducted on geographies consisting of 109,785,632 people shows a strong positive correlation between the proportion of Comanche and percentage of population with at least associate's degree education in the United States with a correlation coefficient (R) of 0.718 and weighted average of 39.9%, a difference of 5.8%.
Associate's Degree Correlation Summary
| Measurement | Immigrants from Fiji | Comanche |
| Minimum | 22.5% | 5.1% |
| Maximum | 82.8% | 100.0% |
| Range | 60.3% | 94.9% |
| Mean | 42.3% | 30.6% |
| Median | 42.3% | 28.4% |
| Interquartile 25% (IQ1) | 34.6% | 23.5% |
| Interquartile 75% (IQ3) | 45.7% | 34.0% |
| Interquartile Range (IQR) | 11.1% | 10.5% |
| Standard Deviation (Sample) | 13.7% | 15.6% |
| Standard Deviation (Population) | 13.4% | 15.3% |
Similar Demographics by Associate's Degree
Demographics Similar to Immigrants from Fiji by Associate's Degree
In terms of associate's degree, the demographic groups most similar to Immigrants from Fiji are Delaware (42.3%, a difference of 0.090%), Immigrants from Ecuador (42.2%, a difference of 0.090%), Immigrants from Cambodia (42.3%, a difference of 0.12%), Immigrants from Liberia (42.3%, a difference of 0.14%), and Jamaican (42.1%, a difference of 0.23%).
| Demographics | Rating | Rank | Associate's Degree |
| Cree | 1.2 /100 | #240 | Tragic 42.5% |
| British West Indians | 1.0 /100 | #241 | Tragic 42.4% |
| Immigrants | West Indies | 1.0 /100 | #242 | Tragic 42.4% |
| Guyanese | 1.0 /100 | #243 | Tragic 42.3% |
| Immigrants | Liberia | 0.9 /100 | #244 | Tragic 42.3% |
| Immigrants | Cambodia | 0.9 /100 | #245 | Tragic 42.3% |
| Delaware | 0.9 /100 | #246 | Tragic 42.3% |
| Immigrants | Fiji | 0.8 /100 | #247 | Tragic 42.2% |
| Immigrants | Ecuador | 0.8 /100 | #248 | Tragic 42.2% |
| Jamaicans | 0.7 /100 | #249 | Tragic 42.1% |
| U.S. Virgin Islanders | 0.7 /100 | #250 | Tragic 42.1% |
| Immigrants | Bahamas | 0.7 /100 | #251 | Tragic 42.1% |
| French American Indians | 0.6 /100 | #252 | Tragic 42.0% |
| Indonesians | 0.6 /100 | #253 | Tragic 41.9% |
| Cubans | 0.6 /100 | #254 | Tragic 41.9% |
Demographics Similar to Comanche by Associate's Degree
In terms of associate's degree, the demographic groups most similar to Comanche are Immigrants from Belize (39.9%, a difference of 0.10%), Haitian (40.0%, a difference of 0.12%), Bangladeshi (40.0%, a difference of 0.26%), Immigrants from Caribbean (39.7%, a difference of 0.44%), and Immigrants from Portugal (40.1%, a difference of 0.58%).
| Demographics | Rating | Rank | Associate's Degree |
| Blackfeet | 0.1 /100 | #277 | Tragic 40.3% |
| Ottawa | 0.1 /100 | #278 | Tragic 40.3% |
| Immigrants | Nicaragua | 0.1 /100 | #279 | Tragic 40.3% |
| Immigrants | Micronesia | 0.1 /100 | #280 | Tragic 40.2% |
| Immigrants | Portugal | 0.1 /100 | #281 | Tragic 40.1% |
| Bangladeshis | 0.1 /100 | #282 | Tragic 40.0% |
| Haitians | 0.1 /100 | #283 | Tragic 40.0% |
| Comanche | 0.1 /100 | #284 | Tragic 39.9% |
| Immigrants | Belize | 0.1 /100 | #285 | Tragic 39.9% |
| Immigrants | Caribbean | 0.0 /100 | #286 | Tragic 39.7% |
| Aleuts | 0.0 /100 | #287 | Tragic 39.6% |
| Immigrants | Cuba | 0.0 /100 | #288 | Tragic 39.5% |
| Central Americans | 0.0 /100 | #289 | Tragic 39.4% |
| Immigrants | Haiti | 0.0 /100 | #290 | Tragic 39.3% |
| Dominicans | 0.0 /100 | #291 | Tragic 39.3% |