Welsh vs Nigerian Associate's Degree
COMPARE
Welsh
Nigerian
Associate's Degree
Associate's Degree Comparison
Welsh
Nigerians
45.9%
ASSOCIATE'S DEGREE
37.9/ 100
METRIC RATING
186th/ 347
METRIC RANK
45.1%
ASSOCIATE'S DEGREE
19.1/ 100
METRIC RATING
204th/ 347
METRIC RANK
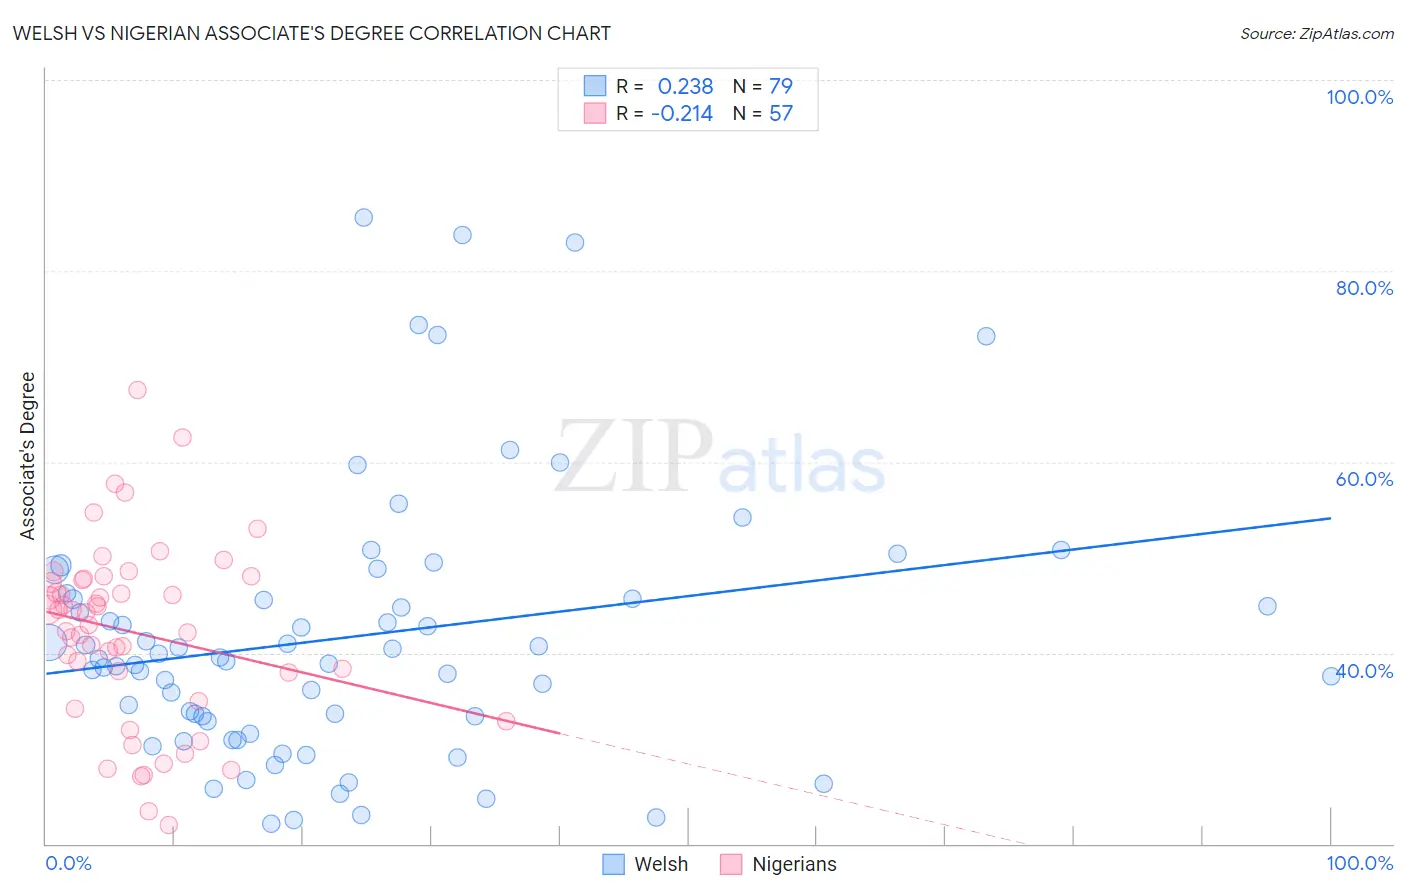
Welsh vs Nigerian Associate's Degree Correlation Chart
The statistical analysis conducted on geographies consisting of 528,554,894 people shows a weak positive correlation between the proportion of Welsh and percentage of population with at least associate's degree education in the United States with a correlation coefficient (R) of 0.238 and weighted average of 45.9%. Similarly, the statistical analysis conducted on geographies consisting of 332,751,702 people shows a weak negative correlation between the proportion of Nigerians and percentage of population with at least associate's degree education in the United States with a correlation coefficient (R) of -0.214 and weighted average of 45.1%, a difference of 1.8%.
Associate's Degree Correlation Summary
| Measurement | Welsh | Nigerian |
| Minimum | 22.1% | 22.0% |
| Maximum | 85.6% | 67.5% |
| Range | 63.5% | 45.6% |
| Mean | 41.7% | 42.1% |
| Median | 39.4% | 44.3% |
| Interquartile 25% (IQ1) | 32.9% | 36.5% |
| Interquartile 75% (IQ3) | 45.7% | 47.7% |
| Interquartile Range (IQR) | 12.8% | 11.2% |
| Standard Deviation (Sample) | 14.0% | 9.4% |
| Standard Deviation (Population) | 13.9% | 9.4% |
Demographics Similar to Welsh and Nigerians by Associate's Degree
In terms of associate's degree, the demographic groups most similar to Welsh are Costa Rican (46.0%, a difference of 0.060%), Immigrants from Uruguay (45.8%, a difference of 0.20%), Ghanaian (45.8%, a difference of 0.20%), Immigrants from Oceania (45.8%, a difference of 0.26%), and Vietnamese (45.8%, a difference of 0.32%). Similarly, the demographic groups most similar to Nigerians are Immigrants from Thailand (45.1%, a difference of 0.020%), Immigrants from South Eastern Asia (45.2%, a difference of 0.14%), Spaniard (45.2%, a difference of 0.16%), Immigrants from Vietnam (45.2%, a difference of 0.21%), and Senegalese (45.2%, a difference of 0.24%).
| Demographics | Rating | Rank | Associate's Degree |
| Costa Ricans | 38.6 /100 | #185 | Fair 46.0% |
| Welsh | 37.9 /100 | #186 | Fair 45.9% |
| Immigrants | Uruguay | 35.5 /100 | #187 | Fair 45.8% |
| Ghanaians | 35.5 /100 | #188 | Fair 45.8% |
| Immigrants | Oceania | 34.7 /100 | #189 | Fair 45.8% |
| Vietnamese | 34.0 /100 | #190 | Fair 45.8% |
| Koreans | 33.8 /100 | #191 | Fair 45.8% |
| Celtics | 33.3 /100 | #192 | Fair 45.8% |
| Immigrants | Cameroon | 31.0 /100 | #193 | Fair 45.7% |
| Immigrants | Peru | 27.6 /100 | #194 | Fair 45.5% |
| Germans | 26.5 /100 | #195 | Fair 45.5% |
| French | 25.6 /100 | #196 | Fair 45.4% |
| Scotch-Irish | 22.3 /100 | #197 | Fair 45.3% |
| Immigrants | Bangladesh | 21.3 /100 | #198 | Fair 45.2% |
| Immigrants | Senegal | 21.2 /100 | #199 | Fair 45.2% |
| Senegalese | 21.1 /100 | #200 | Fair 45.2% |
| Immigrants | Vietnam | 20.8 /100 | #201 | Fair 45.2% |
| Spaniards | 20.4 /100 | #202 | Fair 45.2% |
| Immigrants | South Eastern Asia | 20.2 /100 | #203 | Fair 45.2% |
| Nigerians | 19.1 /100 | #204 | Poor 45.1% |
| Immigrants | Thailand | 18.9 /100 | #205 | Poor 45.1% |